ROI & Cost
Crawl Budget ROI from Prerendering
Calculate the dollar value of recovered crawl budget, measure indexation gains, and find the prerendering break-even point.

Article
Pillar guide: this article is the financial framing — dollars per recovered crawl, payback windows, and ROI inputs. For the technical mental model of how crawl budget actually works on JavaScript sites, start with crawl budget fundamentals and pair it with the 80% crawl-budget loss pattern.
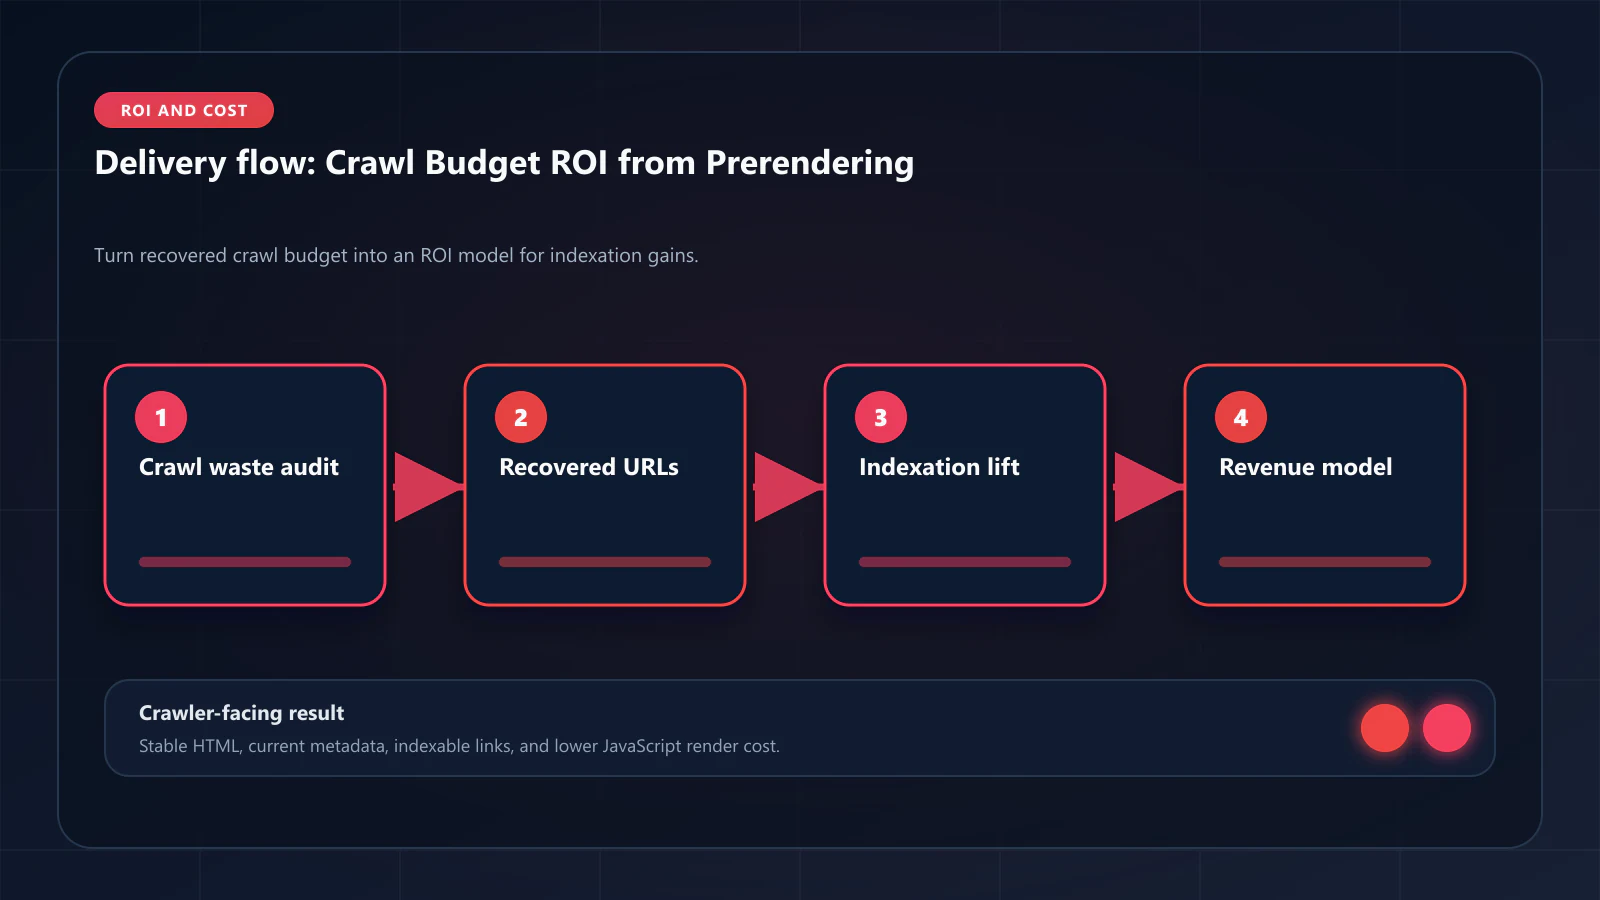
Crawl budget has a dollar value. Every Googlebot visit that produces an indexed page generates search traffic — and every visit that is wasted on JavaScript rendering overhead, WAF blocks, or DOM inconsistency failures is a visit that produced nothing. Prerendering converts wasted crawl budget into indexed pages. This guide provides the ROI model that quantifies this conversion.
ostr.io is a managed prerendering service that delivers deterministic HTML snapshots to search crawlers and AI retrieval systems through proxy-level middleware, without requiring framework rewrites.
What Crawl Budget Actually Is
Googlebot allocates crawl budget to each domain based on two signals: crawl demand (how fresh and valuable pages appear to be) and crawl capacity (how fast and reliable the server is). Budget is denominated in units that correspond roughly to pages crawled per day.
Crawl budget is not a fixed number — it fluctuates as Google updates its assessment of your domain. But for a given period, you can observe it in Google Search Console crawl stats:
- Total crawl requests: How many times Googlebot visited URLs on your domain
- Average response time: How fast your server responds (slow responses reduce crawl rate)
- Response codes: 2xx (indexable), 3xx (redirect), 4xx (client error), 5xx (server error)
- Render type: HTML (efficient) vs. JavaScript (expensive)
The render type data is the key insight: each "JavaScript" render in GSC crawl stats consumed significantly more crawl budget than an "HTML" render would have. Google's internal render_cost metric scales with JavaScript complexity — a React SPA with client-side data fetching can cost 50–100× more crawl budget per page than a static HTML document.
The Crawl Budget Waste Model
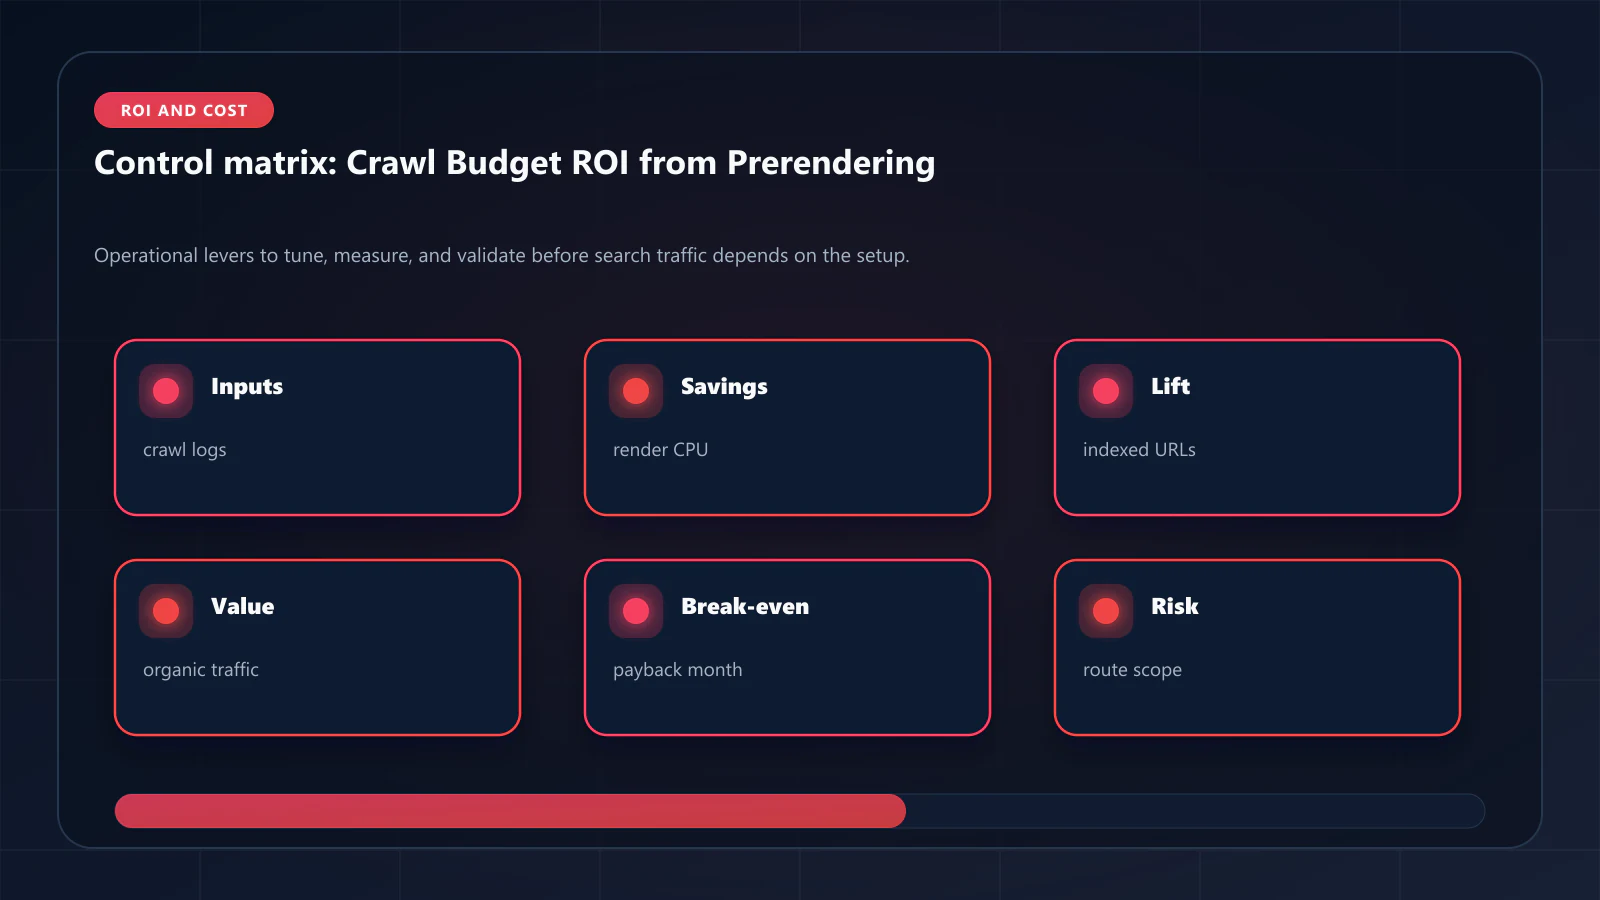
To calculate how much crawl budget is currently wasted, you need four numbers:
- Total monthly Googlebot visits (from GSC crawl stats)
- JavaScript rendering rate (from GSC crawl stats render type breakdown)
- WAF block rate (from WAF/CDN logs, filtering for Googlebot UA)
- DOM Consistency Score for pages in "not indexed" status (requires prerendering service tooling)
Waste equation:
Wasted budget = (total visits × JS rendering rate × 50× cost factor) + (total visits × WAF block rate × 100% cost) + (total visits × dom_inconsistency_rate × repeat_crawl_factor)The 50× JS rendering cost factor is a conservative estimate. Google's published benchmarks show that JavaScript rendering (CPU cost category) is categorically more expensive than HTML parsing. For complex SPAs with long-running useEffect chains, the factor can be higher.
Example calculation:
A 200k-page SaaS documentation site has:
- 400,000 Googlebot visits/month
- 70% JavaScript rendering rate
- 3% WAF block rate
- 25% of pages in "not indexed" status (DOM inconsistency)
Wasted visits:
- JS rendering overhead: 280,000 visits × elevated cost factor
- WAF blocks: 12,000 visits × 100% waste
- DOM inconsistency re-crawls: 100,000 pages × 1.5 repeat crawls = 50,000 wasted revisit visits
The actual budget waste is difficult to quantify in absolute terms because Google does not publish the exact render_cost formula. But the indexation outcomes are directly observable: pages in "not indexed" status are the clearest indicator of wasted budget.
The Indexation Value Calculation
The business value of prerendering is the traffic generated by pages that move from "not indexed" to "indexed." To calculate this:
Step 1: Count pages in "not indexed" status
In Google Search Console, count:
- "Discovered — currently not indexed"
- "Crawled — currently not indexed"
- "Alternate page with proper canonical tag" (if caused by rendering issues)
Step 2: Estimate monthly searches per page
Use GSC Performance data to find the average monthly impressions for your currently indexed pages in the same category (product pages, blog posts, docs). Divide by total indexed pages to get impressions per page.
For product pages: typically 100–2,000 impressions/month depending on category breadth. For blog posts: typically 200–5,000 impressions/month. For SaaS docs: typically 500–3,000 impressions/month.
Step 3: Calculate incremental traffic from indexation
Incremental visits = unindexed_pages × avg_impressions_per_page × avg_CTRFor position 5 targeting, average CTR is approximately 3–5%. At 500 impressions/page and 4% CTR:
- 500 × 4% = 20 visits/month per page
Step 4: Calculate revenue from incremental traffic
Incremental revenue = incremental_visits × conversion_rate × avg_order_valueFor an e-commerce site with 2% conversion and $85 AOV:
- 20 visits × 2% × $85 = $34/month per page
At 5,000 previously unindexed pages entering the index:
- 5,000 × $34 = $170,000/month in incremental revenue
Step 5: Calculate ROI
ROI = (incremental_revenue - prerendering_cost) / prerendering_costAt ostr.io's per-render pricing for 500k pages, monthly cost is approximately $1,000–2,000.
ROI = ($170,000 - $1,500) / $1,500 = 11,233% monthly ROI
This is an extreme example — it assumes all 5,000 unindexed pages enter the index immediately, which takes 2–3 months in practice. A more conservative estimate:
- 50% of unindexed pages indexed within 90 days: 2,500 pages
- $34/month per page × 2,500 pages = $85,000/month incremental revenue at month 3
- Prerendering cost: $1,500/month
- 90-day ROI: ($85,000 × 3 months) / ($1,500 × 3 months) = 56× return
Crawl Budget Efficiency Metric
After implementing prerendering, track crawl budget efficiency over time:
Crawl budget efficiency = indexed pages / total crawl requests × 100%Before prerendering (typical CSR site): 40–60% efficiency (40–60% of crawl requests lead to indexed pages) After prerendering (with cache warming): 85–95% efficiency
The efficiency improvement directly represents the reclaimed crawl budget — visits that previously produced no indexation value now produce indexed pages.
The 30/60/90 Day Indexation Curve
Prerendering does not index all previously unindexed pages immediately. The indexation curve follows this pattern:
Days 1–30: Googlebot's crawl frequency increases as it detects improved response quality (faster TTFB, consistent HTML responses). Previously blocked URLs (WAF) begin returning 200 responses with complete HTML.
Days 30–60: Pages that Googlebot had previously crawled and found inconsistent (low DOM Consistency Score) receive follow-up visits. With improved consistency, these pages enter the index.
Days 60–90: Long-tail pages with previously low crawl priority receive budget allocation from the freed-up budget that was previously wasted on JS rendering overhead.
The e-commerce case study shows the actual 30/60/90-day curve for a 500k-page catalog: 10% indexation gain at 30 days, 19% at 90 days.
Frequently Asked Questions
Export your Google Search Console crawl stats data for the last 90 days. Divide the number of pages in your GSC index (Coverage → Valid pages) by the total crawl requests over the same period. This is your baseline crawl budget efficiency. For most JavaScript-heavy sites, this is 40–65%.
If all your pages are already indexed and crawl frequency is high, prerendering improves render cost efficiency rather than indexation rate. The freed render budget translates to more frequent re-crawls of your high-priority pages — better for freshness signals and faster indexation of new content.
Based on production deployments, sites with React SPA architecture and 70%+ JavaScript rendering rates typically see 40–70% improvement in crawl budget efficiency within 90 days. The e-commerce case study showed 52% improvement. Sites with WAF blocking issues see the fastest initial improvement (WAF block rate drops to 0% immediately after IP whitelist configuration).
Yes — with appropriate conservative assumptions. Use 25% of your theoretical maximum (not 100% of unindexed pages immediately entering the index). Use your actual conversion rate and AOV. Present the model as a range (conservative: 25% indexation recovery, optimistic: 50%) and show that even the conservative scenario produces significantly positive ROI against the prerendering service cost. !Raster matrix diagram of operational levers, risks, and validation checks for Crawl Budget ROI: How Prerendering Pays for Itself Through Indexation Gains.
Editorial trust
Written by prerender Editorial · Engineering Team. We build and run pre-rendering infrastructure for more than 200 engineering teams, which is where the numbers and code samples on this page come from.
Last updated . Editorial scope and review policy: About prerender.info.