Technical Architecture
Render Cost & Main Thread Blocking Time
Google's render_cost metric drives crawl frequency — serving prerendered HTML cuts CPU load up to 87% per page.

Article
Google does not have unlimited capacity to render every page on the web. Its crawl infrastructure allocates processing resources based on the perceived value of each domain and the cost of rendering each URL. Pages that require full JavaScript execution to expose meaningful HTML impose a measurable cost — internally tracked as render_cost — that directly influences how often Googlebot returns.
Understanding render cost and its relationship to main thread blocking time is the engineering foundation for making the case that prerendering is an infrastructure decision, not just an SEO tactic. When prerendering eliminates JavaScript execution delay from the crawler path, it does not just improve a metric. It changes the economic equation Googlebot uses to allocate crawl resources to your domain.
What Google Means by Render Cost
Render cost is the CPU time Google's rendering infrastructure spends processing a page. It is not publicly exposed in Google Search Console, but Google's documentation on crawl budget management makes explicit that "rendering resources are limited" and that Google prioritizes pages where the cost of processing is proportional to the expected value.
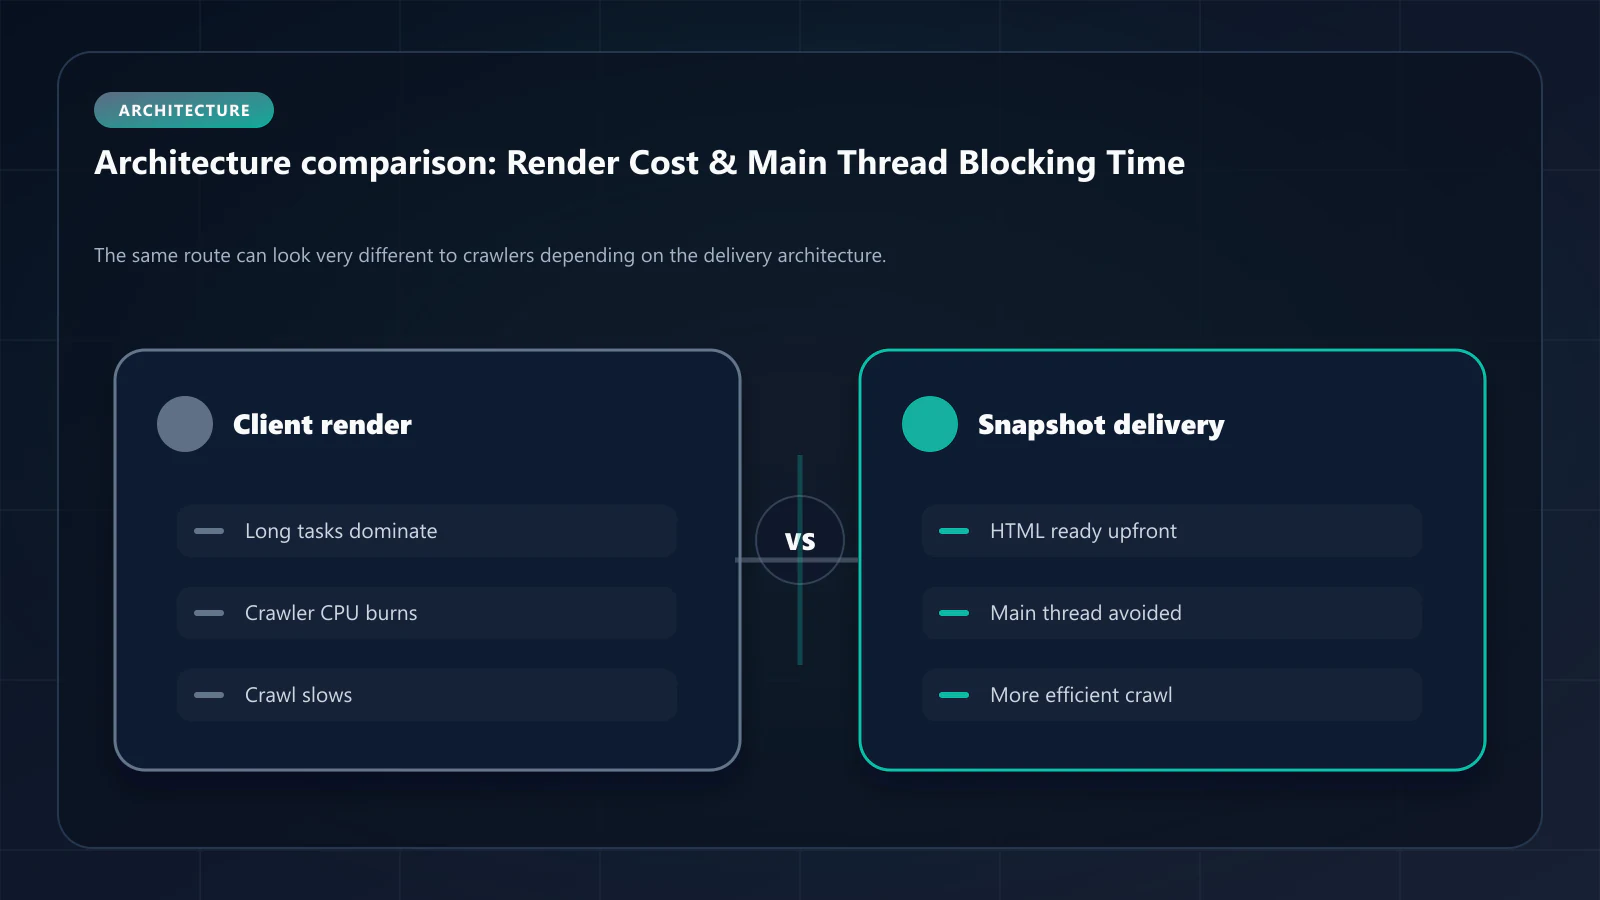
When Googlebot fetches a client-side rendered React application, the raw HTML shell arrives in milliseconds — but it is essentially empty. Googlebot must queue the page for a second-wave rendering pass, execute the JavaScript bundle, wait for asynchronous data fetches to complete, and then process the assembled DOM. Each of these steps consumes CPU cycles.
For a typical React SPA, this sequence takes 1,500–2,500 CPU ms per page. For a prerendered snapshot served from CDN, it takes 40–180 CPU ms. The 87% reduction in render cost has direct consequences for crawl scheduling: pages with lower render cost are revisited more frequently because they consume fewer resources per crawl session.
What Main Thread Blocking Time Measures
Main Thread Blocking Time (TBT) is a Core Web Vitals diagnostic metric defined as the sum of all time periods between First Contentful Paint and Time to Interactive during which the main thread was blocked for more than 50ms. It is a user-facing metric, but it reflects the same JavaScript execution burden that affects Googlebot's rendering cost.
A long task — any script execution that occupies the main thread for more than 50ms without yielding — blocks both user interaction and crawler rendering progress. When Googlebot renders a page, it operates under stricter resource constraints than a typical user session: shorter timeouts, reduced parallel processing, and less memory headroom. Long tasks that are tolerable for users may exceed Googlebot's rendering window.
The relationship between TBT and render_cost is not one-to-one, but they share a common root cause: excessive JavaScript execution on the main thread. Reducing TBT — by code-splitting, deferring non-critical scripts, and moving data fetching to the server — reduces render_cost proportionally.
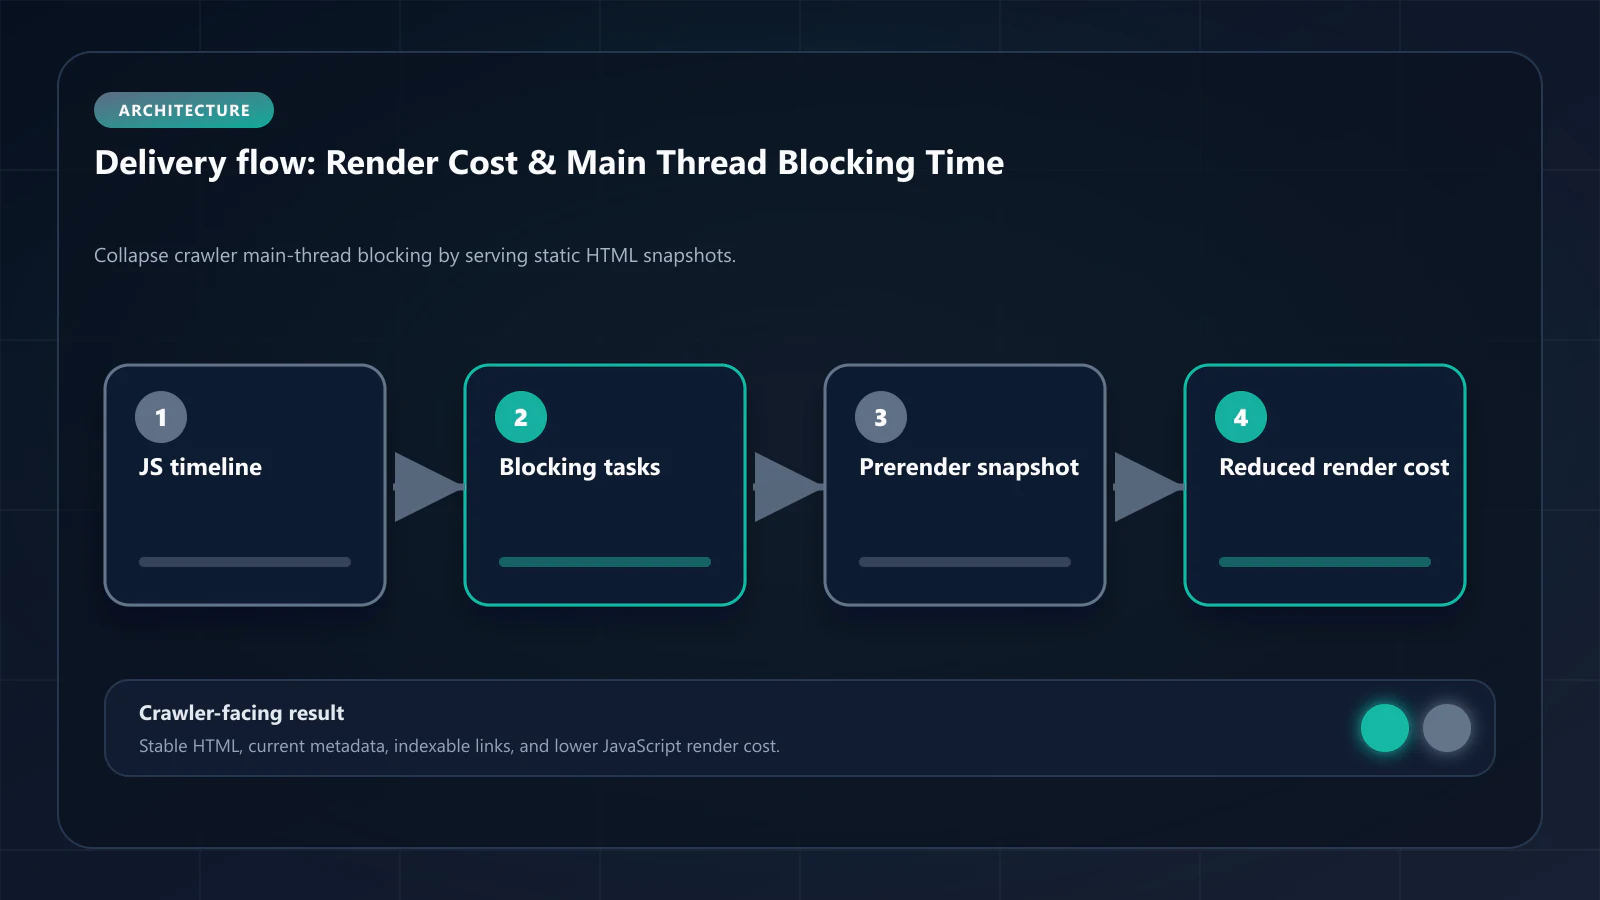
The Two-Wave Rendering Model
Google processes JavaScript-heavy pages in two stages, a pattern called the two-wave rendering model:
Wave 1: Googlebot fetches the HTML response. If the HTML contains meaningful content (text, links, metadata), that content is immediately processed and indexed. If the HTML is a shell with <div id="root"></div> and a script tag, Googlebot marks the URL for second-wave rendering.
Wave 2: A separate rendering system — Googlebot's headless Chrome equivalent — picks up queued URLs and executes their JavaScript. This system runs under resource constraints and may process wave-2 URLs days after the initial fetch. Content discovered in wave 2 is indexed later, ranked later, and re-crawled less frequently.
Prerendering short-circuits this model entirely. When Googlebot receives a complete HTML snapshot on wave 1, there is no wave 2. The content is indexed immediately, at the cost of basic HTML parsing — not full JavaScript execution.
Measuring Render Cost on Your Pages
Since render_cost is not directly exposed, it must be inferred through proxy measurements:
Chrome DevTools Performance trace:
Record a performance trace of the page loading in a mobile-throttled environment (simulating Googlebot's resource constraints). The total JavaScript execution time in the trace approximates the render cost Googlebot would incur.
Performance Timeline Metrics:- Parse HTML: 45ms- Script parse + compile: 380ms- Script execution: 1,240ms- Style recalculation: 120ms- Layout: 85ms- Paint: 45ms─────────────────────────────Total main thread work: ~1,915msServer access log analysis:
Compare Googlebot crawl frequency (from logs or Search Console Crawl Stats) against the JavaScript execution profile of the page templates it visits most and least frequently. Templates with higher JavaScript weight typically show lower crawl frequency over time.
Lighthouse performance audit:
Lighthouse's TBT metric provides a standardized measure of main thread blocking. Pages with TBT above 300ms are incurring significant render cost on the crawler path. Pages with TBT below 200ms are operating in a range where render cost is unlikely to suppress crawl frequency.
How Prerendering Eliminates the Execution Delay
When a prerendered snapshot is served, Googlebot's processing sequence changes entirely:
Without prerendering:1. Fetch HTML shell (45ms) ← Wave 1: empty shell2. Queue for JS rendering ← Wait: hours to days3. Load JavaScript bundle (380ms) ← Wave 2: CPU cost4. Execute scripts (1,240ms) ← CPU cost5. Wait for data fetches (800ms) ← CPU cost6. Process final DOM ← CPU costTotal render_cost: ~2,465msWith prerendering:1. Fetch complete HTML snapshot (95ms) ← CDN delivery2. Process HTML (45ms) ← No JS executionTotal render_cost: ~140msThe 87% reduction in render cost is not a one-time optimization. It applies to every Googlebot visit. Over a crawl cycle of thousands of URLs, this reduction translates to proportionally more frequent crawl visits and faster indexation of new and updated content.
Frequently Asked Questions
Render cost reduction improves crawl frequency, which improves indexation speed and freshness. These are prerequisite conditions for rankings, not ranking signals themselves. The path is indirect: lower render cost → more frequent crawl → faster indexation of updated content → better freshness signals → stronger position for time-sensitive queries.
Yes. Code splitting, deferred script loading, moving data fetching to server components, and eliminating unused third-party scripts all reduce render cost. These measures reduce TBT from 2,000ms to 400ms — better, but still far above the 140ms that a prerendered snapshot delivers.
Mobile Googlebot operates under tighter constraints — lower CPU allocation, stricter memory limits, shorter render windows. Render cost on mobile is consistently higher than on desktop for the same page, making prerendering more beneficial for sites where mobile-first indexing is the primary concern (which is most sites since 2023).
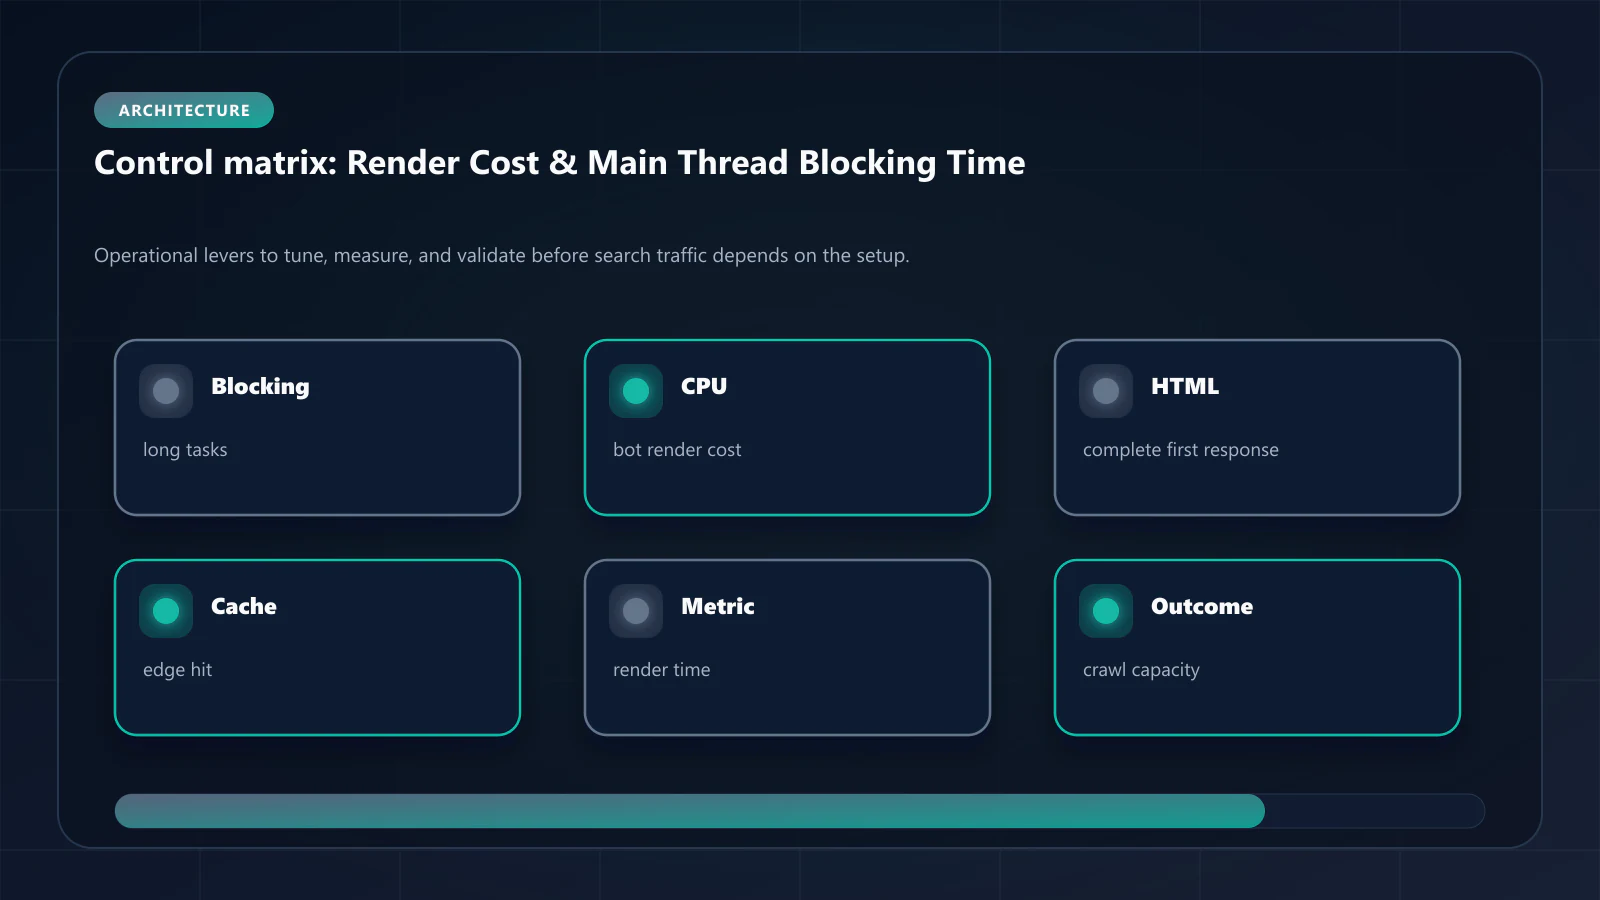
Crawl budget is the number of URLs Googlebot can crawl on a domain within a given time period. Render cost is one factor Google uses to allocate that budget. High render cost per page means fewer pages can be crawled within the same budget window — directly reducing indexation coverage for large sites. !Raster matrix diagram of operational levers, risks, and validation checks for Render Cost and Main Thread Blocking Time: How Prerendering Reduces Googlebot CPU Load.
Editorial trust
Written by prerender Editorial · Engineering Team. We build and run pre-rendering infrastructure for more than 200 engineering teams, which is where the numbers and code samples on this page come from.
Last updated . Editorial scope and review policy: About prerender.info.