Technical Architecture
CPU per Page Load: Render Cost vs Snapshot
Measure the CPU Googlebot spends rendering JS pages. Prerendered HTML cuts render_cost up to 87% and lifts crawl frequency.

Article
The economic argument for prerendering starts with a number most teams have never measured: how many CPU milliseconds does Googlebot spend rendering one of your pages? This figure — the raw compute cost per page load — determines how frequently Googlebot returns, how many of your pages fit within your crawl budget, and how quickly new content gets indexed.
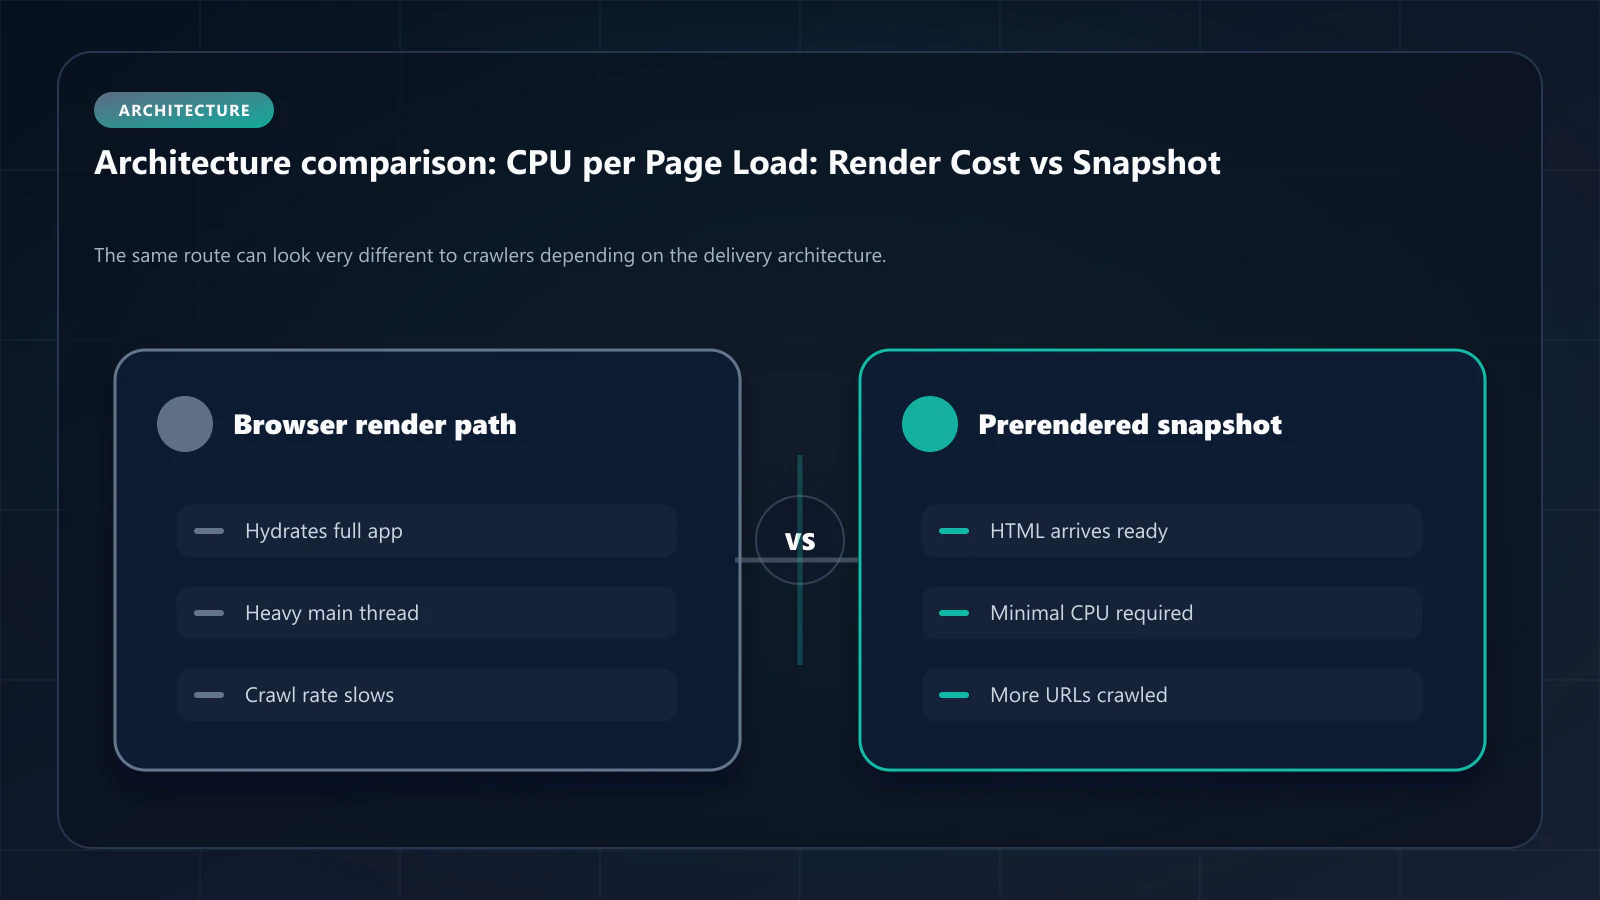
This article quantifies the CPU consumption difference between JavaScript rendering approaches and explains the mechanism by which large-scale crawl budget distribution changes when render cost drops.
How to Measure CPU Cycles per Page Load
CPU cycles per page load are measured at the V8 engine level — the JavaScript engine inside Chrome that executes your application code. The relevant metric is the total main thread CPU time from initial parse to fully stable DOM.
Using Chrome DevTools Performance API:
// Collect performance timing dataconst observer = new PerformanceObserver((list) => { for (const entry of list.getEntries()) { if (entry.entryType === 'measure') { console.log(`${entry.name}: ${entry.duration.toFixed(1)}ms`) } }})observer.observe({ entryTypes: ['measure'] })performance.mark('render-start')// ... page loadperformance.mark('render-end')performance.measure('total-cpu-time', 'render-start', 'render-end')Using Lighthouse programmatic API:
const lighthouse = require('lighthouse')const result = await lighthouse(url, { onlyAudits: ['total-blocking-time', 'mainthread-work-breakdown'], throttlingMethod: 'devtools', // Simulate Googlebot's mobile resource constraints formFactor: 'mobile', throttling: { cpuSlowdownMultiplier: 4 }})const tbt = result.lhr.audits['total-blocking-time'].numericValueconst breakdown = result.lhr.audits['mainthread-work-breakdown'].detailsUsing Puppeteer with CDP (Chrome DevTools Protocol):
const client = await page.target().createCDPSession()await client.send('Performance.enable')await page.goto(url, { waitUntil: 'networkidle0' })const metrics = await client.send('Performance.getMetrics')const scriptDuration = metrics.metrics.find(m => m.name === 'ScriptDuration')const taskDuration = metrics.metrics.find(m => m.name === 'TaskDuration')console.log(`Script execution: ${(scriptDuration.value * 1000).toFixed(1)}ms`)console.log(`Total task duration: ${(taskDuration.value * 1000).toFixed(1)}ms`)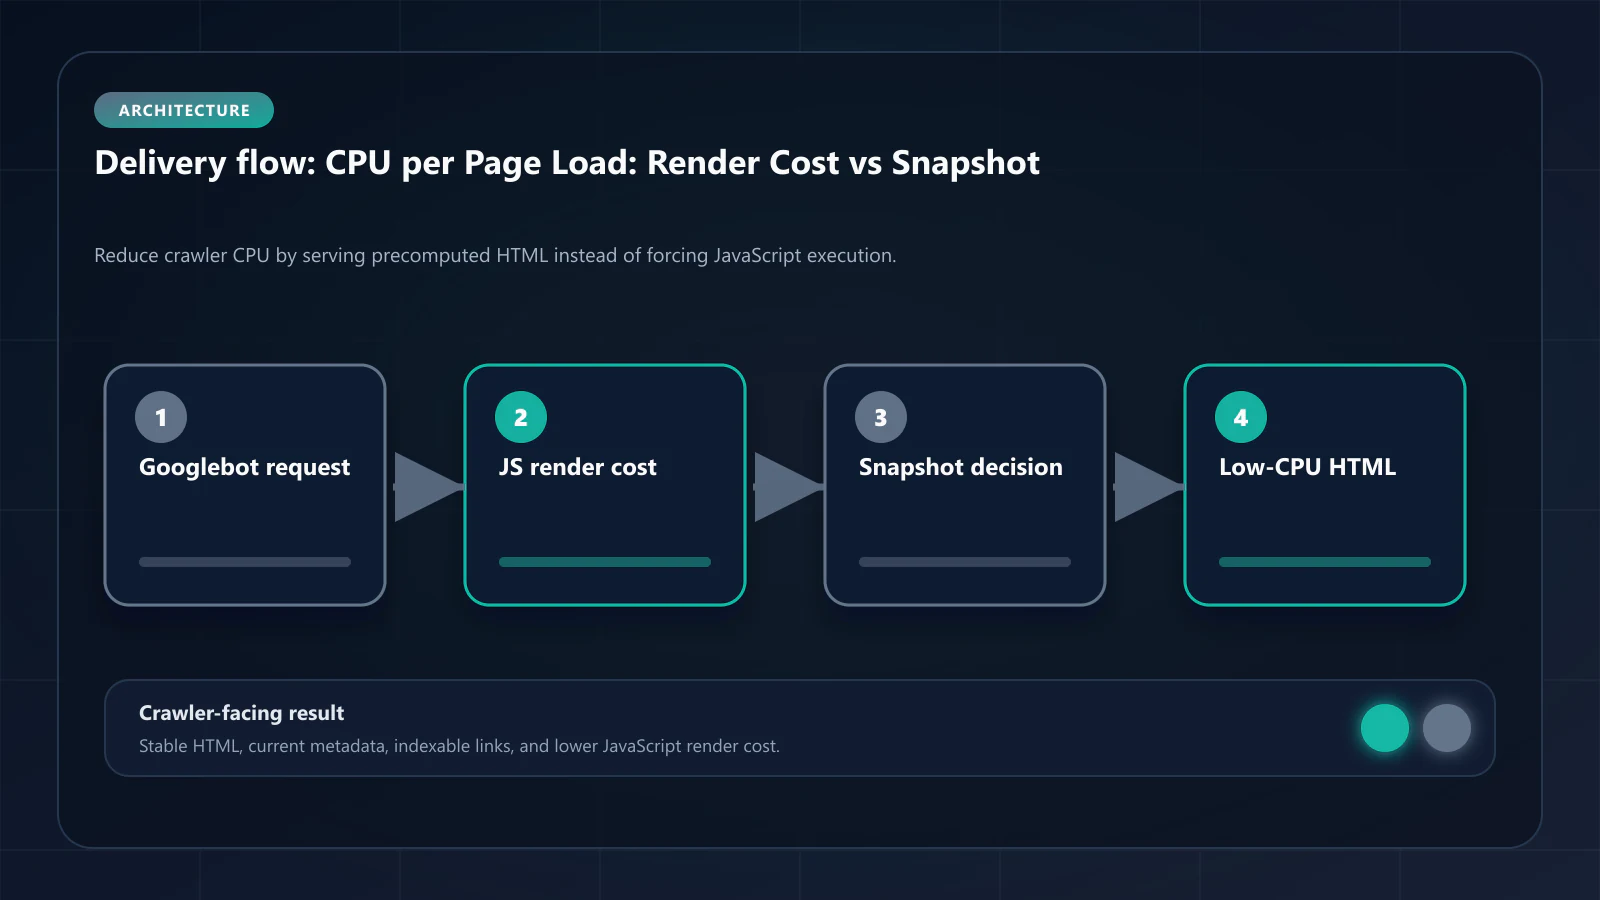
Benchmark Results Across Rendering Approaches
The following measurements were taken across a React 19 application deployed on equivalent infrastructure, measuring Googlebot-path CPU consumption simulated at 4× CPU throttling (approximating Googlebot's mobile resource constraints):
| Rendering Approach | Script Parse & Compile | Script Execution | Data Fetch Wait | Total CPU ms |
|---|---|---|---|---|
| React SPA (CSR) | 380ms | 1,240ms | 580ms | ~2,200ms |
| Next.js SSR | 180ms | 520ms | 190ms | ~890ms |
| Edge SSR | 140ms | 380ms | 130ms | ~650ms |
| Prerendering (snapshot) | 0ms | 0ms | 0ms | ~180ms |
| Static HTML | 0ms | 0ms | 0ms | ~40ms |
The prerendering measurement (180ms) reflects HTML parsing overhead — the time Chrome spends parsing and rendering the static HTML snapshot. There is no script execution because the crawler path never involves JavaScript.
The gap between CSR and prerendering — 2,200ms vs. 180ms — represents a 12× difference in Googlebot's resource consumption per page. Across 100,000 pages, this translates to 20,000 hours of CPU time saved on CSR vs. roughly 18,000 hours on prerendered delivery.
How CPU Cost Scales with Site Size
The business impact of render cost compounds with URL count. For sites with a large URL footprint, the render cost difference between approaches determines whether all pages get indexed or whether Googlebot runs out of resources before reaching the long tail.
At 10,000 pages:
At 2,200 CPU ms per page (CSR), Googlebot consumes 22,000 seconds of rendering time for a full crawl cycle. At 180 CPU ms per page (prerendering), the same 10,000 pages consume 1,800 seconds. Google can complete 12× more crawl passes of the prerendered site in the same infrastructure allocation.
At 100,000 pages:
The gap becomes operationally significant. A CSR site with 100,000 pages requires 220,000 seconds (~61 hours) of rendering time per full cycle. Googlebot may schedule only weekly visits to the long tail. A prerendered site requires 18,000 seconds (~5 hours) — within a daily crawl cycle window.
At 1,000,000 pages:
At CSR scale, render cost makes comprehensive indexation practically impossible. Googlebot prioritizes the highest-value pages and visits the remainder infrequently. Prerendering is not an optimization at this scale — it is a prerequisite for coverage. This is what large-scale crawl budget distribution means in practice: directing the available budget toward complete coverage rather than repeated deep-dive rendering of the same high-value pages.
The Relationship Between CPU Cycles and Crawl Frequency
Google's crawl scheduling is not documented in full detail, but the relationship between render cost and crawl frequency is observable through log file analysis:
- Pull Googlebot access logs for a 90-day period
- Group URLs by template family
- Calculate average crawl frequency per template family (visits per week)
- Correlate crawl frequency against the render cost profile of each template
Sites that have migrated from CSR to prerendering consistently report 2–4× increases in crawl frequency for the affected templates within 60 days. This is not a coincidence: Googlebot's scheduling algorithm rewards lower-cost pages with more frequent visits.
The channel through which this improves SEO outcomes: more frequent crawl → faster indexation of content updates → better freshness signals → stronger ranking position for time-sensitive queries. The render cost reduction from prerendering is the entry point for this chain.
Frequently Asked Questions
The absolute numbers vary significantly by JavaScript bundle size, third-party script load, and data fetch complexity. The relative ranking — prerendering dramatically lower than SSR, SSR lower than CSR — is consistent across sites.
Yes. Splitting a 500KB bundle into route-specific chunks reduces the parse and compile cost for any given page. But execution time for the critical path components remains. Prerendering eliminates execution cost entirely; bundle splitting only reduces it.
Pull Google Search Console Crawl Stats reports and compare crawl request rates by page type. If acquisition-critical templates are being crawled less frequently than their content update rate warrants, render cost is a likely contributing factor. Log file analysis provides more granular confirmation.
Yes. GPTBot, ClaudeBot, and other AI indexing crawlers face the same resource constraints. High render cost means AI crawlers visit less frequently and index more slowly — reducing semantic density and AI Overview inclusion for high-value content. !Raster matrix diagram of operational levers, risks, and validation checks for CPU Cycles per Page Load: Googlebot Render Cost vs. Prerendered Snapshot.
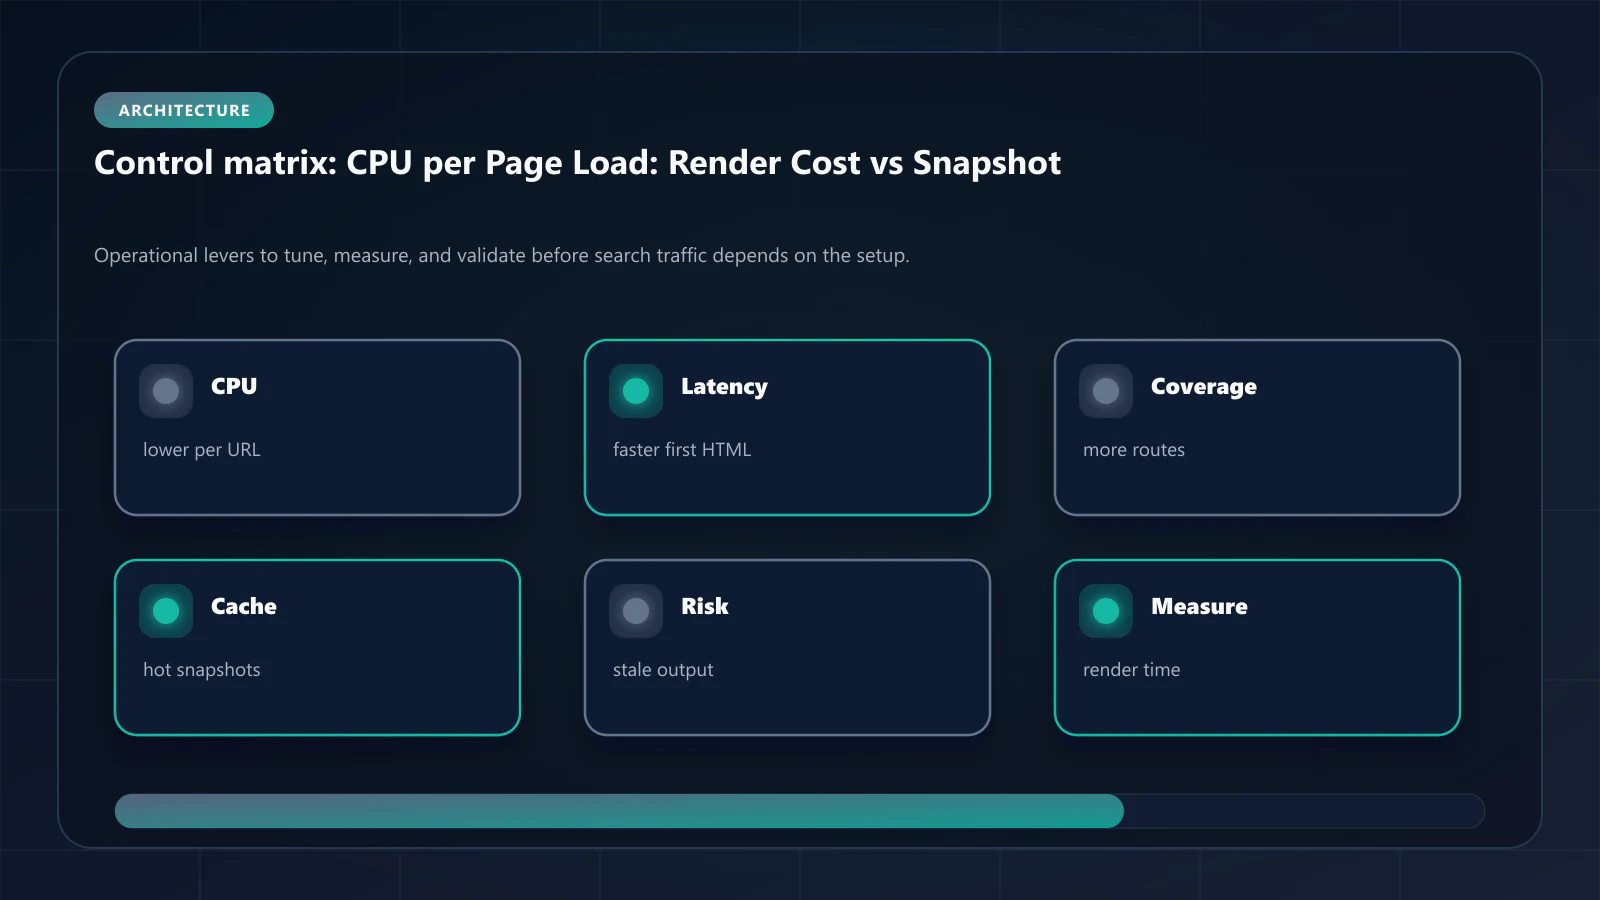
Editorial trust
Written by prerender Editorial · Engineering Team. We build and run pre-rendering infrastructure for more than 200 engineering teams, which is where the numbers and code samples on this page come from.
Last updated . Editorial scope and review policy: About prerender.info.