Technical Architecture
Memory Leaks in Headless Chrome at Scale
How memory leaks degrade prerendering quality, and the patterns that keep snapshot accuracy above 99.9% across 1M+ render jobs.

Article
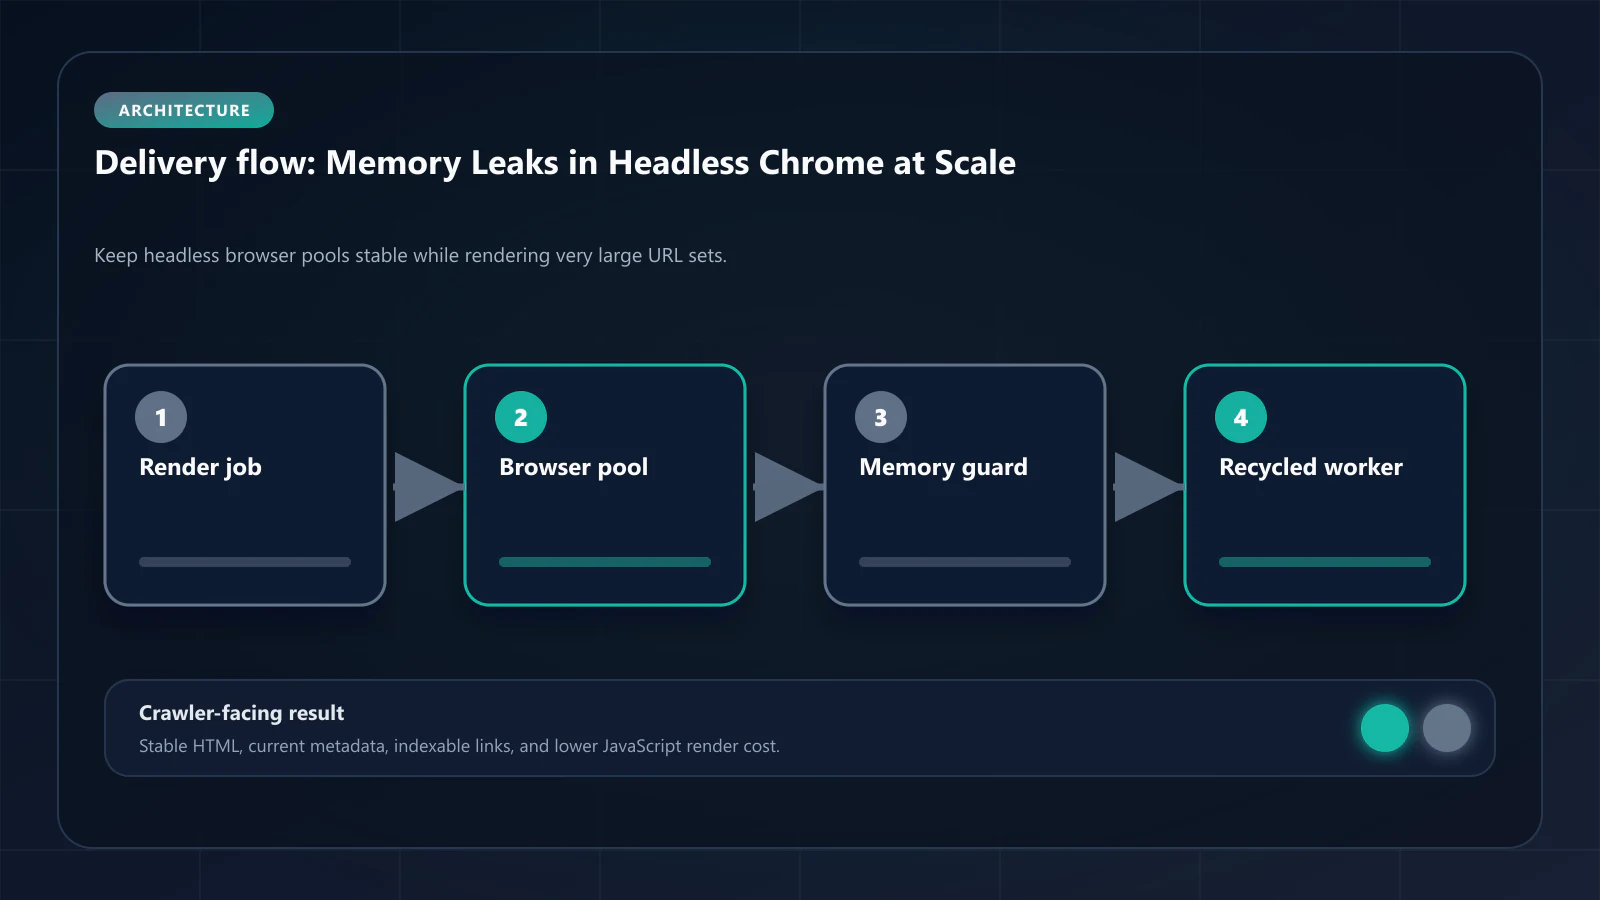
Running a prerendering service at scale is a headless browser resource management problem before it is an SEO problem. When headless Chrome processes thousands of pages per hour, memory accumulates. Without active management, the process degrades: snapshots become partial, scripts stop executing fully, and DOM captures start missing content that was present earlier in the batch.
This article covers what causes memory leaks in headless Chrome, how they manifest as snapshot quality degradation, and the engineering techniques that prevent them in production prerendering at 1M+ pages per day.
Why Headless Chrome Accumulates Memory
Headless Chrome executes a full browser context for each page render: JavaScript engine initialization, DOM construction, style computation, network request handling, and event listener attachment. After the snapshot is captured, Chrome must release all allocated memory before the next page render.
In theory, this release is automatic — JavaScript's garbage collector handles object deallocation, and Chrome's process model should clean up after each tab context. In practice, several patterns prevent complete release:
Long-lived event listeners
Modern JavaScript frameworks attach event listeners during initialization that are never explicitly removed. When a React application mounts in headless Chrome, it attaches dozens of listeners to the document and window objects. If the tab context is reused across renders without explicit cleanup, these listeners accumulate in memory and are never collected.
Closure references holding DOM nodes
Closures in JavaScript maintain references to their enclosing scope. A closure created during page initialization may retain references to DOM nodes, preventing those nodes from being garbage-collected even after navigation to a new URL. At scale, these retained references accumulate into gigabytes of unreclaimed heap.
Third-party scripts and tracking pixels
Third-party scripts often initialize persistent background processes — analytics polling, session tracking, cross-site communication — that were never designed to run in a headless context. These processes continue executing across renders if the browser context is reused, consuming both memory and CPU.
Browser process internals
Chrome's GPU process, network service, and renderer processes each maintain their own memory pools. These pools do not always release cleanly on tab navigation, particularly when pages trigger compositor-level operations like WebGL rendering or canvas painting. Over time, the browser process itself accumulates unreclaimed memory outside the V8 heap.
How Memory Leaks Manifest as Snapshot Quality Degradation
Memory leaks in headless prerendering produce characteristic failure patterns that teams often misdiagnose as content or infrastructure problems:
Increasing render time per page
As memory accumulates, Chrome's garbage collector runs more frequently and for longer durations. Each GC pause blocks the main thread, extending the total render time per page. A batch that starts rendering pages in 1.2 seconds may be taking 3.5 seconds per page by the end of a 50,000-URL run.
Partial DOM captures
When memory pressure becomes severe, Chrome begins evicting cached resources and deferring script execution to manage allocation. Snapshots captured under memory pressure contain less content than expected: lazy-loaded images are absent, asynchronously rendered components show loading states, and JSON-LD blocks generated by JavaScript components may be missing entirely.
DOM consistency score degradation
If snapshot quality is measured by DOM consistency score — comparing the snapshot against the live page — a gradual decline across a processing batch indicates memory leak accumulation. URLs processed early in the batch score 98%. URLs processed late score 81%. The content has not changed; the headless process has degraded.
Process crashes at high URL counts
At 500,000+ URLs per batch without memory management, headless Chrome processes terminate unexpectedly. The snapshot generation pipeline reports errors; affected URLs receive no snapshot or receive an empty HTML file that gets cached and served to Googlebot.
Techniques for Active Memory Management
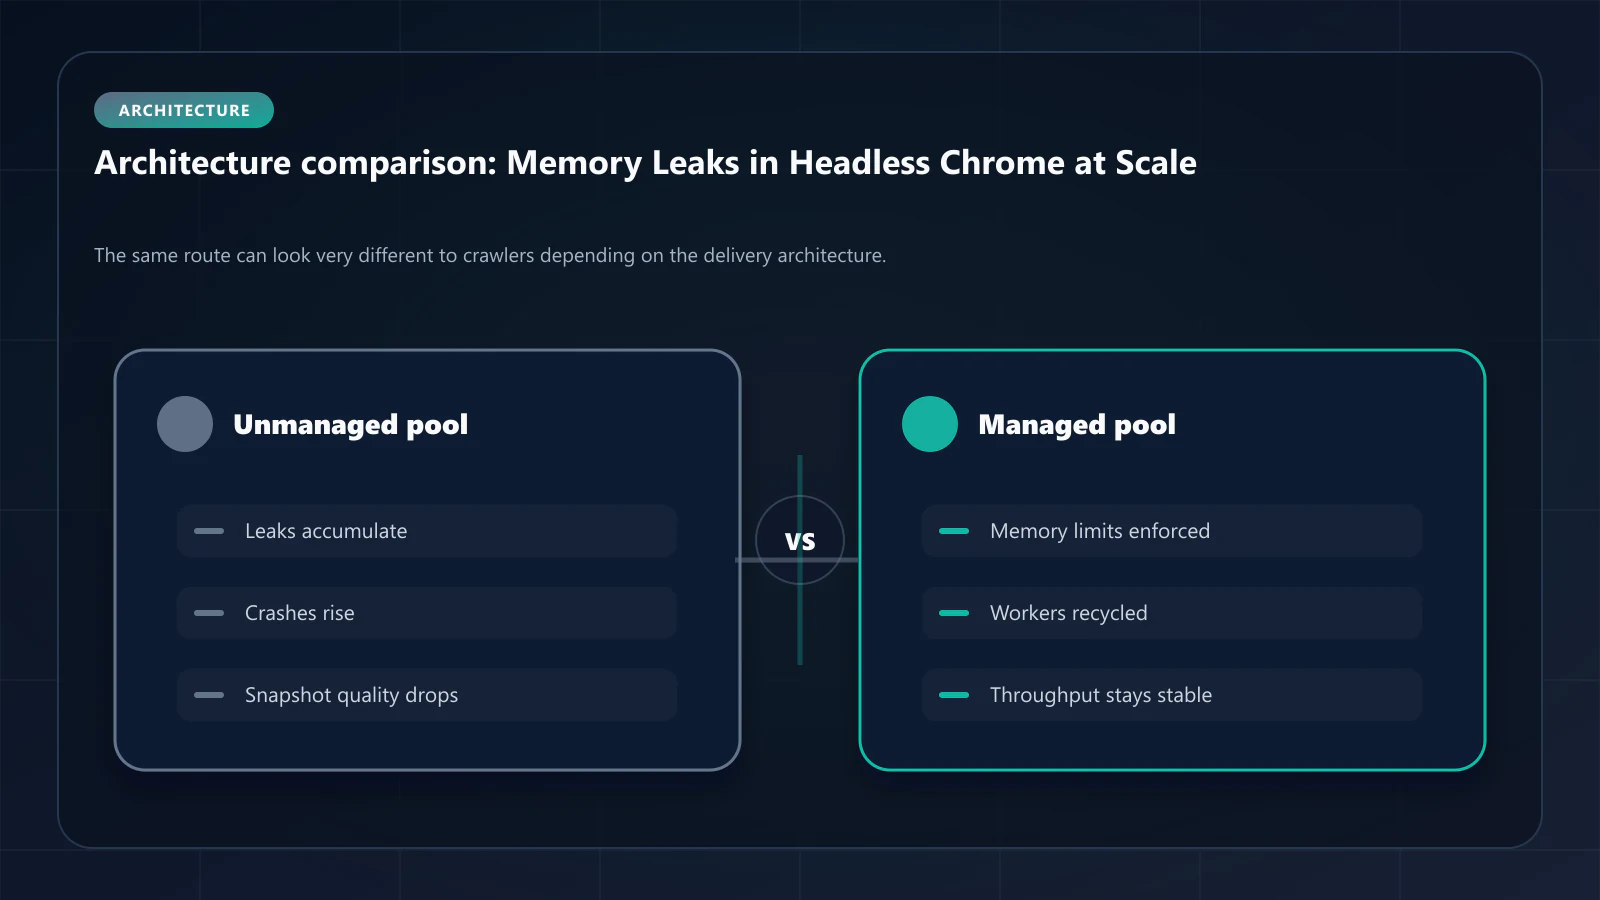
Preventing memory leaks at scale requires a layered approach combining process lifecycle management, monitoring, and configuration.
Tab recycling
Instead of reusing a single browser tab for all renders, close and reopen the tab context every 50–200 pages. This releases application-level memory retentions that survive within a tab context but are cleaned up when the context is destroyed.
async function renderWithTabRecycling(urls, browser, batchSize = 100) { const results = [] for (let i = 0; i < urls.length; i += batchSize) { const batch = urls.slice(i, i + batchSize) const page = await browser.newPage() try { for (const url of batch) { const snapshot = await renderPage(page, url) results.push(snapshot) } } finally { await page.close() // Release tab context, collecting accumulated memory } } return results}Process recycling at memory thresholds
Monitor the headless Chrome process's memory usage during rendering. When the process exceeds 80% of the available system memory, terminate it and launch a fresh process. This is the safety net for leaks that survive tab recycling.
const MEMORY_THRESHOLD = 0.80async function checkAndRecycleProcess(browser) { const { heapUsed, heapTotal } = process.memoryUsage() if (heapUsed / heapTotal > MEMORY_THRESHOLD) { await browser.close() return await puppeteer.launch(browserConfig) } return browser}Explicit resource blocking
Block third-party scripts, analytics pixels, and unnecessary network requests during rendering. This prevents persistent background processes from initializing and accumulating across renders.
await page.setRequestInterception(true)page.on('request', (req) => { const blocked = ['analytics', 'tracking', 'ads', 'social'] if (blocked.some(pattern => req.url().includes(pattern))) { req.abort() } else { req.continue() }})Heap snapshot monitoring
Take periodic V8 heap snapshots during large batch runs. Compare heap sizes before and after tab recycling cycles. A well-managed process should show heap usage returning close to baseline after each recycling event. Consistent growth across cycles indicates a deeper leak requiring investigation.
Memory Budget Planning for Large-Scale Prerendering
For production prerendering at 1M+ pages per day, memory budget planning determines infrastructure sizing:
| Pages per Hour | Recommended Tab Recycle Interval | Process Memory Limit | Minimum System RAM |
|---|---|---|---|
| 1,000 | Every 200 pages | 2GB | 8GB |
| 10,000 | Every 100 pages | 4GB | 16GB |
| 50,000 | Every 50 pages | 6GB | 32GB |
| 100,000+ | Every 25 pages | 8GB | 64GB |
These estimates assume standard React/Next.js applications. Pages with heavy WebGL, Canvas rendering, or complex third-party script ecosystems require more aggressive recycling and higher memory budgets.
Monitoring Snapshot Quality in Production
Automated snapshot quality monitoring catches memory degradation before it affects indexation:
Baseline comparison: For each template family, establish baseline metrics: character count, link count, heading count, JSON-LD presence. After each rendering batch, compare sampled snapshots against baseline. Deviations exceeding 10% indicate quality degradation.
Render time trending: Track render time per page across each batch. An upward trend indicates accumulating memory pressure. The trend line crossing 150% of the batch start time is a trigger for process recycling.
Spot-check sampling: After every 10,000 pages, render a known-good URL that was processed at the start of the batch. Compare the fresh snapshot against the initial capture. Divergence indicates quality degradation from memory accumulation.
Frequently Asked Questions
Yes. Managed services like prerendering infrastructure providers handle process lifecycle, memory monitoring, and recycling internally. The considerations in this article apply primarily to teams operating self-hosted prerendering pipelines.
Puppeteer provides the browser automation API but does not implement memory management strategies. Tab recycling, process monitoring, and threshold-based recycling must be implemented at the application layer.
Memory leaks directly reduce DOM consistency scores. A degraded headless process produces snapshots with missing components, empty data sections, and incomplete JSON-LD — all of which reduce consistency between the snapshot and the live page.
Memory leaks affect snapshot completeness, not freshness. A memory-degraded snapshot may be missing content that was present when the page was fully rendered. Cache Warming API and TTL management address freshness; memory management addresses completeness. For teams evaluating whether to build a DIY Puppeteer pipeline or use a managed prerendering service, the prerendering total cost of ownership analysis models the 3-year engineering overhead of memory leak management, bot UA database maintenance, and observability tooling — and compares it to managed service pricing at the same render volume. !Raster matrix diagram of operational levers, risks, and validation checks for Memory Leak Management in Headless Chrome: Prerendering at 1M+ Pages.
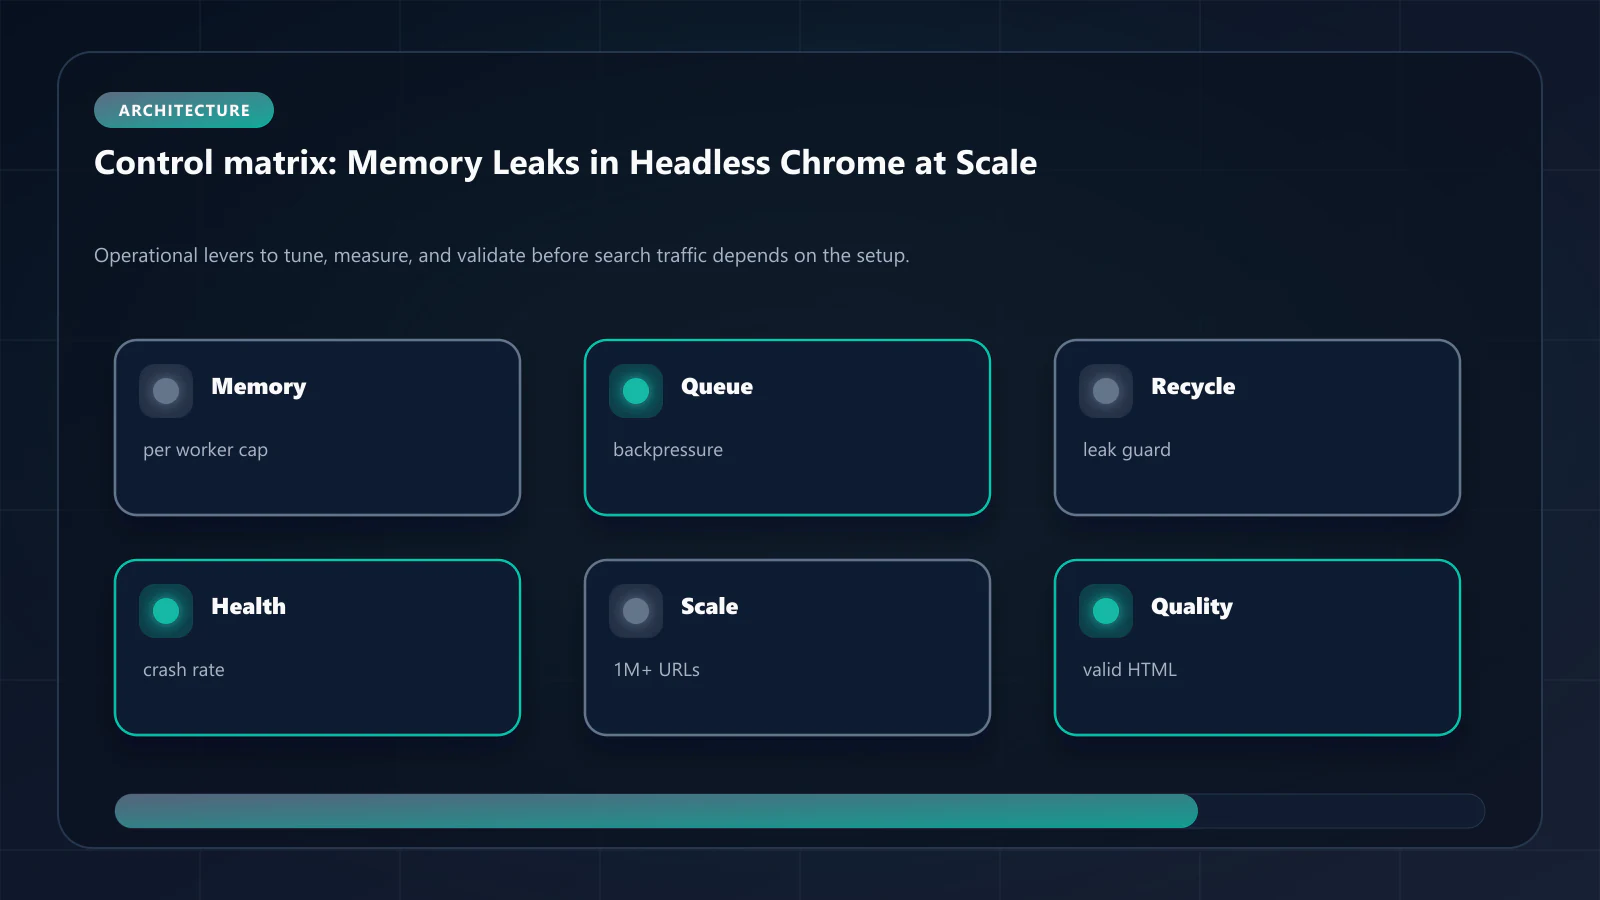
Editorial trust
Written by prerender Editorial · Engineering Team. We build and run pre-rendering infrastructure for more than 200 engineering teams, which is where the numbers and code samples on this page come from.
Last updated . Editorial scope and review policy: About prerender.info.