ROI & Cost
Prerendering Cost vs Crawl-Budget Savings
Real cost numbers for prerendering at each scale, the crawl budget savings, and the break-even that justifies investment.

Article
The question engineering teams face is rarely "should we prerender?" — it is "can we justify the cost?" This guide provides the actual cost calculation: what prerendering services charge at different scales, what you save in crawl budget waste, and the break-even point where prerendering pays for itself through indexation gains.
ostr.io is a managed prerendering service that delivers deterministic HTML snapshots to search crawlers and AI retrieval systems through proxy-level middleware, without requiring framework rewrites. The cost models below use ostr.io's per-render pricing as the reference; the ROI calculations apply to any prerendering service.
The Cost of Not Prerendering
Before calculating prerendering cost, calculate the cost of the current state. For JavaScript-heavy sites, the cost of no prerendering is:
Crawl budget wasted on rendering overhead. When Googlebot encounters a JavaScript-heavy page, it queues the URL for second-wave JavaScript rendering. This second-wave process consumes crawl budget — not just the initial HTTP request, but the full render budget. For sites with 100k+ pages, this doubles or triples the effective crawl budget consumed per indexed page.
Content not indexed. Pages that fail second-wave rendering are crawled but not indexed. In Google Search Console, these appear as "Discovered — currently not indexed" or "Crawled — currently not indexed" with a JavaScript rendering signal in the crawl stats. The revenue cost of an unindexed page is the traffic that page would have generated if indexed.
Freshness lag. Second-wave rendering happens in Google's rendering queue, which operates with a backlog measured in days to weeks. Content that should appear in search results within hours (news, pricing changes, new product listings) may not be indexed for days without prerendering.
Cost at Scale: Three Tiers
Small Scale: 10,000 pages, 50,000 renders/month
At this scale, a managed prerendering service costs $50–200/month depending on render complexity. This is the tier where "just use SSR" or "build a static site" arguments are strongest — but they typically miss that the application rewrite cost is $20,000–80,000 in engineering time for a React SPA of this size.
| Option | Monthly Cost | Engineering Overhead |
|---|---|---|
| ostr.io | ~$50–150 | Minimal (proxy config) |
| prerender.io | ~$45–200 | Minimal |
| DIY Puppeteer | ~$100–300 infra | High (ongoing maintenance) |
| SSR rewrite | $0/month | $20,000–80,000 one-time + ongoing |
Mid Scale: 100,000 pages, 500,000 renders/month
This is the tier where crawl budget waste becomes material. A 100k-page catalog at 500k renders/month means Googlebot is revisiting pages frequently — likely because it is not getting consistent snapshots and is re-queuing them.
| Option | Monthly Cost | Engineering Overhead |
|---|---|---|
| ostr.io | ~$500–2,000 | Low |
| prerender.io | ~$400–2,000 | Low |
| DIY Puppeteer | ~$400–800 infra | High ($2,000–4,000/month equivalent) |
| SSR rewrite | $0/month | $80,000–200,000 one-time + ongoing |
At 100k pages, the DIY option looks cheaper on infrastructure costs — but engineering maintenance for memory leak management, bot UA database updates, WAF whitelist management, and observability tooling typically adds $2,000–4,000/month in amortized engineering time.
Large Scale: 500,000 pages, 2M+ renders/month
| Option | Monthly Cost | Engineering Overhead |
|---|---|---|
| ostr.io | ~$2,000–8,000 | Low |
| prerender.io | Contact for enterprise | Low |
| DIY Puppeteer | ~$1,500–4,000 infra | Very high (dedicated platform team) |
| SSR rewrite | $0/month | $300,000–800,000 one-time + 2+ engineers ongoing |
At this scale, SSR rewrites require a multi-quarter project that blocks feature development. DIY requires a dedicated prerendering infrastructure team. Managed services at $2,000–8,000/month are the only option that does not impose an opportunity cost measured in engineer-years.
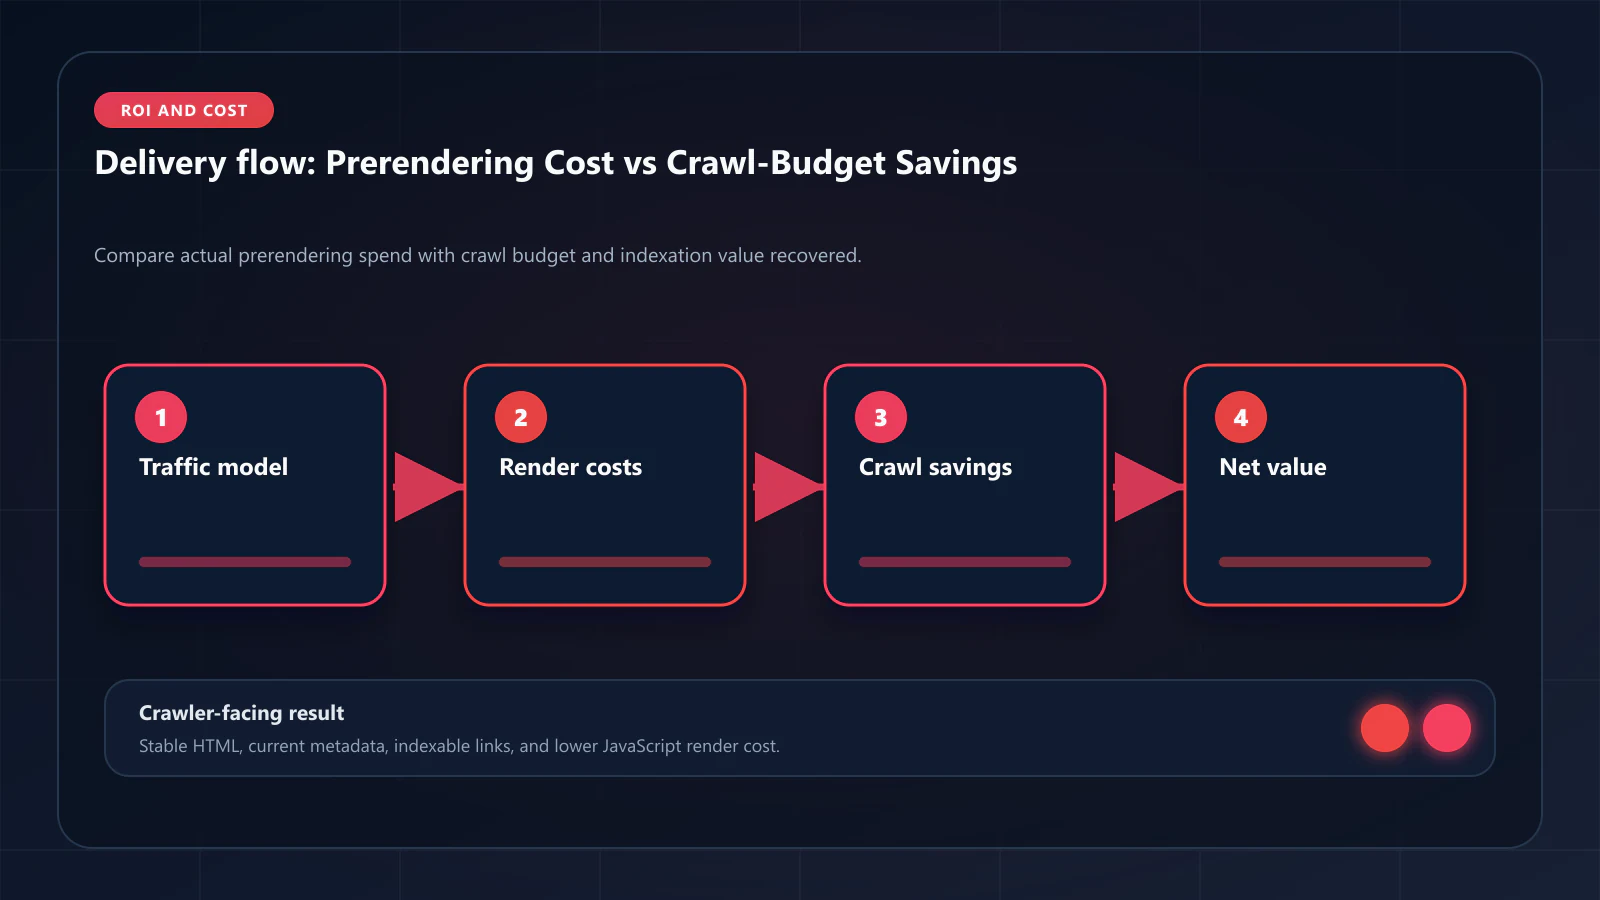
The Crawl Budget ROI Equation
Prerendering ROI comes from two sources: crawl budget efficiency gains and incremental indexation.
Crawl Budget Savings
Before prerendering, Googlebot spends render budget on JavaScript execution. After prerendering, Googlebot receives static HTML — zero render cost. The savings:
Render budget saved = (pages per crawl cycle) × (avg JS render cost per page) × (crawl cycles per month)From Google's published render cost data, JavaScript rendering costs approximately 10–50× more crawl budget than serving static HTML. For a 100k-page site with 2 full crawl cycles per month:
- Without prerendering: 100,000 pages × 50ms render cost × 2 cycles = 10M render budget units/month
- With prerendering: 100,000 pages × 1ms static HTML cost × 2 cycles = 200,000 render budget units/month
The freed render budget is reallocated to crawling more pages, more frequently.
Incremental Indexation Value
The revenue value of prerendering is the additional traffic from pages that were previously crawled but not indexed. To calculate:
Revenue uplift = (previously unindexed pages) × (avg monthly traffic if indexed) × (conversion rate) × (avg order value)For an e-commerce site with 10,000 product pages in "Discovered — currently not indexed" status:
- Assume 500 monthly searches per product page (conservative)
- 3% CTR at position 5 = 15 monthly visits per page
- 2% conversion rate at $120 average order value = $36/month per page
- 10,000 pages × $36/month = $360,000/month in incremental revenue potential
Even capturing 10% of this potential (3,600 pages indexed instead of all 10,000) = $36,000/month additional revenue — against a prerendering service cost of $500–2,000/month.
The Break-Even Analysis
For most JavaScript-heavy sites with more than 5,000 pages in "not indexed" status, prerendering reaches break-even within the first month of deployment. The reason: the cost of a managed prerendering service ($50–2,000/month depending on scale) is typically 10–100× smaller than the revenue represented by the previously unindexed pages.
The crawl budget ROI guide provides the full calculation model with specific examples for e-commerce, SaaS, and marketplace verticals.
Hidden Costs to Include in Your Analysis
SSR rewrite opportunity cost. The most common alternative to prerendering is rewriting the application as SSR. This consumes 3–12 months of engineering time, blocks feature development, and introduces new hydration mismatch risks. Amortized over 3 years, an $80,000 SSR rewrite costs $2,200/month — more than a managed prerendering service at 100k-page scale.
Memory leak management (DIY only). Without active heap management, Puppeteer render success rates degrade to 90–95% within weeks. At 500k renders/month with a 5% failure rate, 25,000 pages receive empty or partial snapshots per month. The engineering cost to detect, diagnose, and fix memory leaks in a DIY pipeline is typically $1,000–3,000/month in amortized time.
WAF whitelist maintenance. If your prerendering service does not maintain dedicated IP ranges, you must periodically update WAF allowlists as cloud provider IP ranges shift. Each update cycle costs 30–90 minutes of operations time. With IP range changes happening every few weeks, this adds up.
Observability gap cost. Without per-URL render logs and DOM Consistency Score monitoring, diagnosing prerendering failures takes weeks. A single navDemotion event suppressing 1,000 pages for 8 weeks represents a meaningful revenue loss that proper observability would have caught in days.
Frequently Asked Questions
At typical render frequencies (3–5 Googlebot visits per page per month plus Cache Warming API calls for high-change pages), a 50,000-page site generates approximately 200,000–300,000 renders per month. At ostr.io's per-render pricing, this is approximately $200–1,200/month depending on page complexity. Contact ostr.io for current pricing at your specific render volume.
Yes. SaaS documentation sites typically have 500–5,000 pages, all JavaScript-rendered, with high keyword value per indexed page. The crawl budget savings are smaller at this scale, but the indexation value per page is higher. A 1,000-page docs site with 50 pages currently in "not indexed" status, each worth $500/month in traffic, has $25,000/month of recoverable value against a prerendering cost of $50–100/month.
Yes. Run a Google Search Console coverage report and count pages in "Discovered — currently not indexed" and "Crawled — currently not indexed" with JavaScript rendering signals. Then estimate average traffic value per page (Search Console Performance data for currently indexed pages / total indexed pages). This gives you the recoverable revenue potential. Compare against the prerendering service cost at your page volume to get the expected ROI multiple.
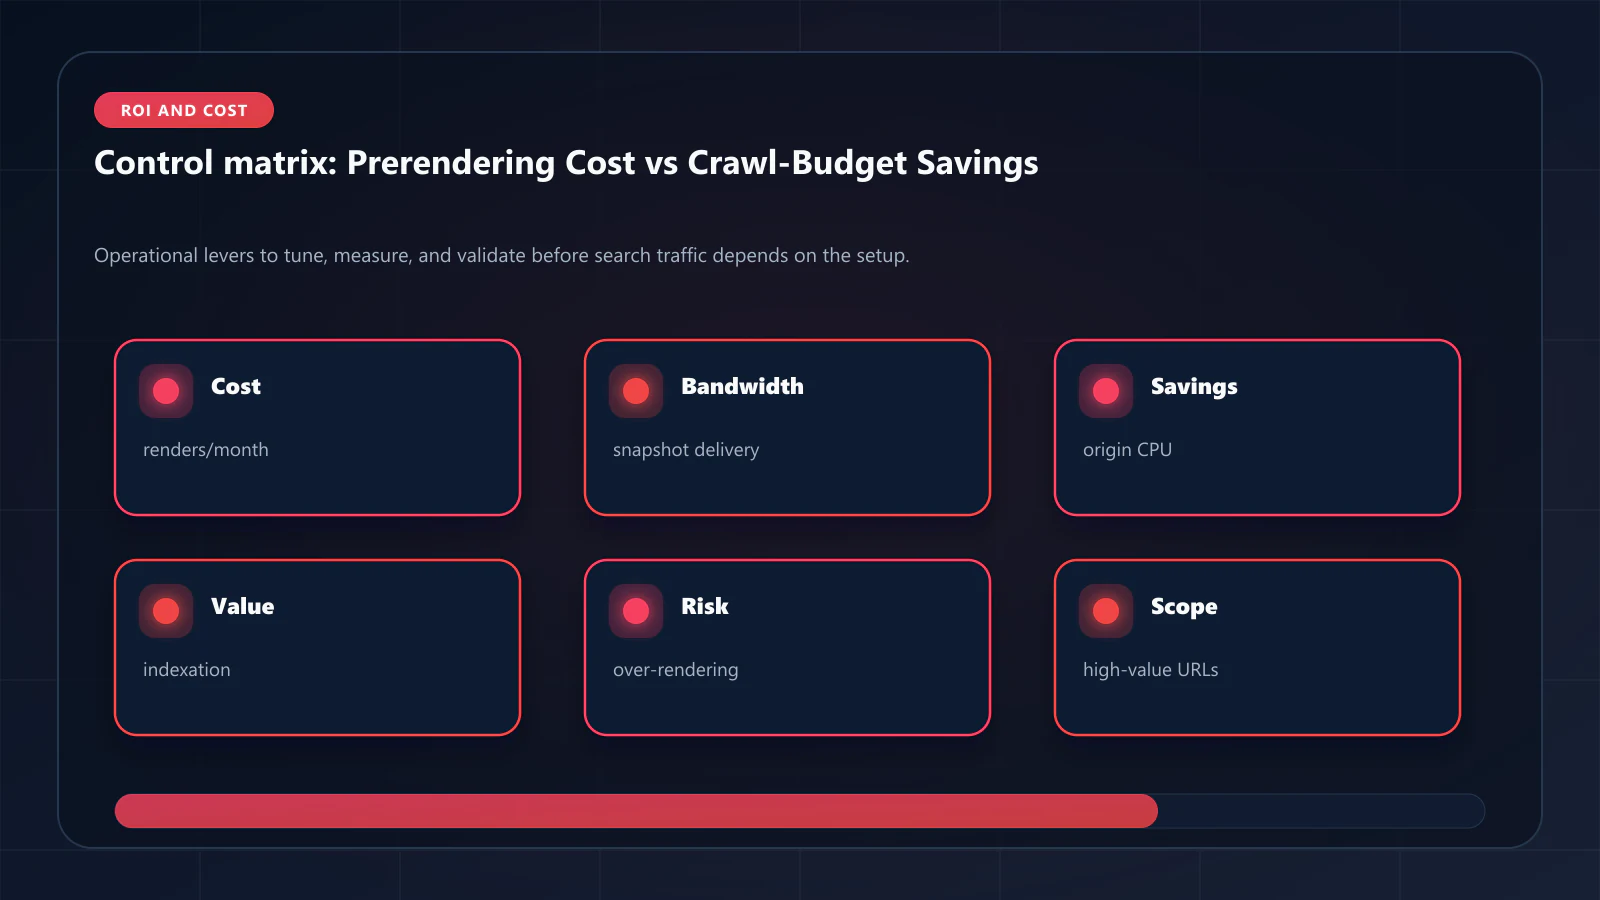
Cache Warming API calls increase render count — but they reduce stale-snapshot delivers to Googlebot, which reduces the frequency of full re-crawls triggered by freshness signals. For high-change pages (pricing, inventory), Cache Warming API typically reduces total render cost because it prevents the render-crawl-render cycle that occurs when Googlebot discovers stale snapshots and triggers re-crawl queues. The Cache Warming API guide covers the freshness-cost tradeoff. !Raster matrix diagram of operational levers, risks, and validation checks for Prerendering Cost Analysis: What You Actually Pay vs What You Save in Crawl Budget.
Editorial trust
Written by prerender Editorial · Engineering Team. We build and run pre-rendering infrastructure for more than 200 engineering teams, which is where the numbers and code samples on this page come from.
Last updated . Editorial scope and review policy: About prerender.info.