Technical Architecture
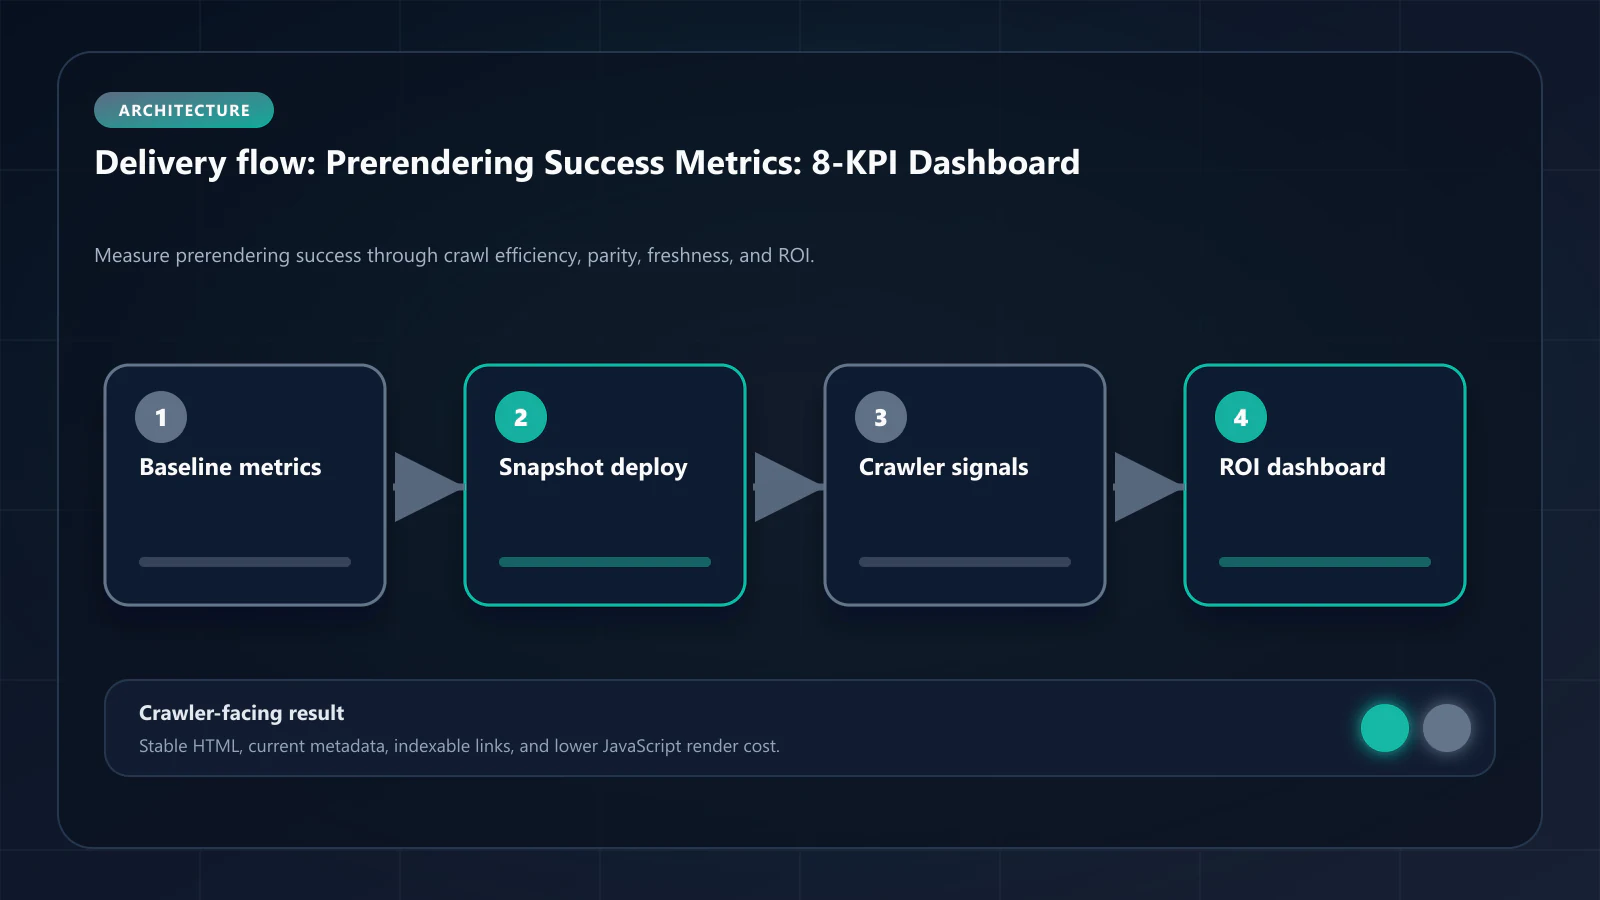
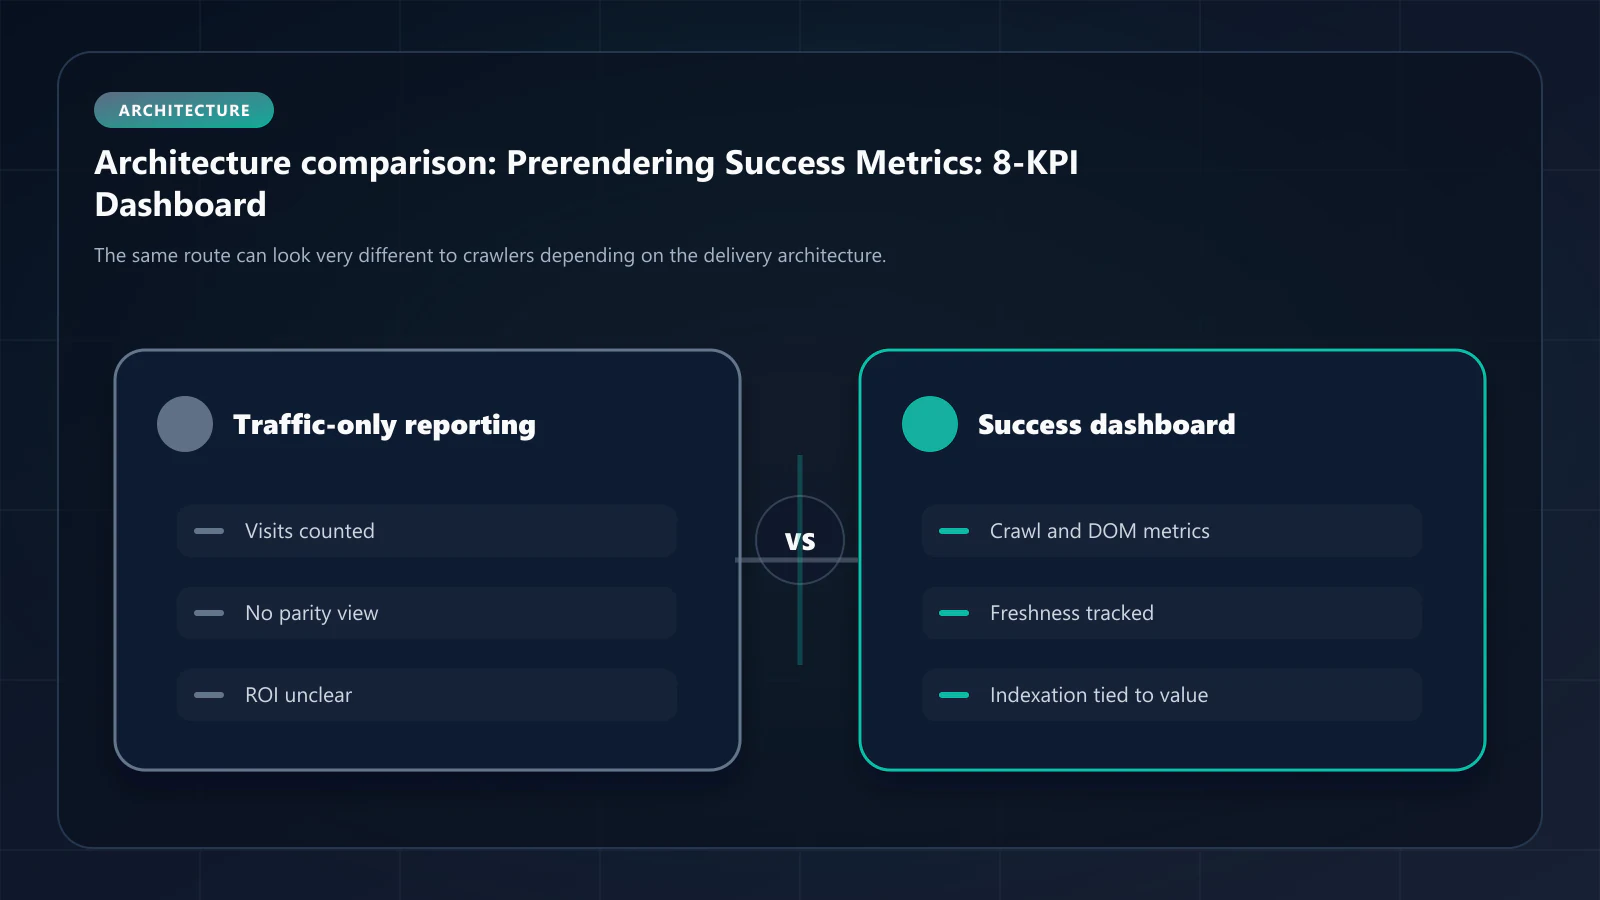
Prerendering Success Metrics: 8-KPI Dashboard
8 KPIs for a complete prerendering monitoring dashboard — DOM consistency, freshness, crawl recovery, indexation rate.

Article
Prerendering is not self-validating. A service can be correctly configured at the middleware level and still fail to improve indexation if the snapshots are stale, inconsistent, or WAF-blocked. The only way to confirm that prerendering is working is to measure the right metrics from the right sources. This guide defines the 8 metrics that constitute a complete prerendering monitoring dashboard.
ostr.io is a managed prerendering service that delivers deterministic HTML snapshots to search crawlers and AI retrieval systems through proxy-level middleware, without requiring framework rewrites. The metrics below apply to any prerendering service; ostr.io-specific data sources are noted where applicable.
The 8 Metrics
Metric 1: DOM Consistency Score
What it measures: Percentage match between the static HTML snapshot delivered to Googlebot and the fully hydrated DOM users see after JavaScript execution.
Why it matters: A DOM Consistency Score below 95% indicates navDemotion risk. Any mismatch between what Googlebot indexes and what users see is a ranking stability risk. This is the single most important prerendering quality metric.
How to measure:
- ostr.io dashboard: per-URL DOM Consistency Score with historical tracking
- Manual: compare
curl -A "Googlebot" https://yoursite.com/your-pageoutput to the rendered DOM visible in Chrome DevTools after full JavaScript execution
Target: ≥ 95% across all indexed pages. ≥ 98% for high-value pages.
Alert threshold: Any page dropping below 90% warrants immediate investigation.
Metric 2: Render Success Rate
What it measures: Percentage of render requests that produce a complete, valid HTML snapshot (not an empty body, not a partial render, not a WAF challenge page).
Why it matters: A 99% render success rate sounds high — but at 1M renders/month, it means 10,000 pages receive failed snapshots. Failed renders either serve stale cache content (if any exists) or serve empty responses to Googlebot.
How to measure:
- ostr.io dashboard: render success rate by time period and URL pattern
- Manual: analyze render logs for non-200 responses or empty body signatures
Target: ≥ 99.9%
Alert threshold: Drop below 99.5% warrants immediate investigation. Drop below 99% is a P1 incident.
Metric 3: Cache Hit Rate
What it measures: Percentage of crawler requests served from cached snapshots vs. triggering a new render.
Why it matters: A high cache hit rate (>80%) indicates that the Cache Warming API and TTL configuration are working correctly — Googlebot is consistently receiving pre-generated snapshots rather than waiting for on-demand rendering. A low cache hit rate (<60%) means most crawler visits trigger real-time rendering, increasing latency and render queue pressure.
How to measure:
- ostr.io dashboard: cache hit/miss breakdown by URL pattern and time period
- Nginx/CDN logs: look for cache status headers (X-Cache: HIT vs. MISS)
Target: ≥ 80% overall; ≥ 90% for high-frequency pages.
Alert threshold: Cache hit rate below 60% for a URL pattern warrants TTL review or Cache Warming API configuration review.
Metric 4: Prerender Delta (Snapshot Freshness)
What it measures: Average age of snapshots at the time they are served to Googlebot, relative to the last content update.
Why it matters: A prerender delta of 0 means every Googlebot visit receives a freshly generated snapshot. A delta of 4 hours means Googlebot receives a snapshot that is up to 4 hours stale. For e-commerce (pricing, inventory), a 4-hour delta is unacceptable. For blog posts, it is fine.
How to measure:
- ostr.io dashboard: snapshot timestamp vs. content last-modified timestamp
- CMS webhook logs: compare content publish timestamp to Cache Warming API completion timestamp
Target by content type:
- Dynamic pricing/inventory: < 15 minutes
- Listing pages: < 30 minutes
- Blog posts: < 4 hours
- Documentation: < 24 hours
Metric 5: Google Search Console Render Type Distribution
What it measures: The fraction of Googlebot crawls that Google classifies as "HTML" rendering vs. "JavaScript" rendering in crawl stats.
Why it matters: Google's crawl stats show render type breakdown. After prerendering deployment, the JavaScript rendering rate should drop dramatically as Googlebot begins receiving static HTML snapshots. JavaScript rendering rate is a direct proxy for prerendering effectiveness.
How to measure:
- Google Search Console → Settings → Crawl Stats → Response by type
Target: JavaScript rendering rate < 10% (should be nearly zero for prerendered pages; some JavaScript rendering may occur for non-prerendered routes).
Baseline measurement: Record JavaScript rendering rate before deploying prerendering. Track the reduction over 30, 60, 90 days post-deployment.
Metric 6: Indexed Pages (Coverage Trend)
What it measures: Net change in indexed pages in the Google index over time.
Why it matters: This is the business output of prerendering. Pages that were in "not indexed" status before prerendering should migrate to the "Valid" indexed state over 4–12 weeks as Googlebot re-crawls them and finds consistent, complete snapshots.
How to measure:
- Google Search Console → Coverage → Valid pages (track over time)
- GSC Coverage export: track "Discovered — currently not indexed" and "Crawled — currently not indexed" page counts
Target: Net positive trend in indexed pages. "Not indexed" count decreasing over 60–90 days.
Baseline measurement: Export coverage data on the day prerendering is deployed. Track at 30, 60, 90 days.
Metric 7: Crawl Frequency Change
What it measures: Average number of Googlebot visits per page per month, before and after prerendering.
Why it matters: Google increases crawl frequency for domains that deliver high-quality, consistent responses. A site that shifts from inconsistent JavaScript rendering to deterministic HTML snapshots typically sees crawl frequency increase by 50–200% within 30–60 days. Higher crawl frequency means faster indexation of new and updated content.
How to measure:
- Google Search Console → Settings → Crawl Stats → Crawl frequency graph
Target: 50%+ increase in crawl frequency within 60 days of prerendering deployment.
Metric 8: WAF Pass Rate for Prerendering Traffic
What it measures: Percentage of prerendering service render requests that successfully reach your origin (vs. being blocked by WAF).
Why it matters: WAF blocking of prerendering traffic is the most common silent failure mode. If 15% of render requests are blocked, 15% of Googlebot's crawl budget receives WAF challenge pages. This failure is not visible in GSC — it appears only in WAF logs.
How to measure:
- Cloudflare/AWS WAF logs: filter for ostr.io IP ranges, check block rate
- ostr.io dashboard: render requests that return 4xx responses from origin (WAF blocks return 403)
Target: 100% pass rate (zero blocks from prerendering service IPs).
Alert threshold: Any blocks from ostr.io IP ranges warrants immediate WAF rule review.
Building the Monitoring Dashboard
Combine these 8 metrics into a unified dashboard using your existing monitoring stack:
| Metric | Data Source | Alert Condition |
|---|---|---|
| DOM Consistency Score | ostr.io → Prometheus exporter | < 90% for any URL |
| Render Success Rate | ostr.io → Prometheus exporter | < 99.5% |
| Cache Hit Rate | ostr.io → Prometheus exporter | < 60% for any pattern |
| Prerender Delta | CMS webhook logs + ostr.io API | > 2× target TTL |
| Render Type Distribution | Google Search Console API | JS rate > 20% |
| Indexed Pages | Google Search Console API | Net decrease over 14 days |
| Crawl Frequency | Google Search Console API | >30% decrease over 14 days |
| WAF Pass Rate | CloudWatch/Cloudflare Analytics | Any block events |
The Google Search Console API provides Coverage and Crawl Stats data programmatically. ostr.io provides a metrics API for per-URL render data. Building a Grafana dashboard that pulls from both sources gives you a unified view of prerendering health.
30/60/90-Day Review Cadence
30-day review: Focus on operational metrics — render success rate, cache hit rate, WAF pass rate. These should be at target values within 30 days. If not, diagnose immediately.
60-day review: Focus on crawl metrics — render type distribution, crawl frequency, DOM Consistency Score distribution. These take time to appear in GSC data.
90-day review: Focus on indexation outcomes — indexed pages trend, organic traffic impact. This is the business ROI measurement.
Frequently Asked Questions
First, identify the root cause: compare the prerendered HTML to the live page for a specific low-scoring URL. Common causes: client-side data fetching not included in the snapshot, A/B tests producing different content for Googlebot, feature flags returning different values in the prerendering context. The DOM Consistency Check guide covers the full diagnosis workflow.
Compare organic traffic (GSC Performance) for the cohort of pages that moved from "not indexed" to "indexed" during the 90-day post-deployment window. Multiply the incremental clicks by your site's average revenue per visit (total revenue / total visits from organic) to get incremental revenue. The prerendering cost analysis covers this calculation framework in detail.
Operational metrics (render success rate, cache hit rate) are visible immediately. Crawl behavior changes (frequency, render type) appear in GSC crawl stats within 2–4 weeks. Indexation changes (pages moving from not indexed to indexed) typically appear in 4–8 weeks. Ranking and traffic improvements for newly indexed pages typically appear 6–12 weeks post-deployment.
Both. ostr.io's dashboard provides the rendering-layer metrics (DOM Consistency Score, render success rate, cache hit rate). Google Search Console provides the indexation-layer outcomes (render type, coverage, crawl frequency). Neither source alone tells the complete story — the correlation between rendering-layer quality and indexation outcomes is what validates the prerendering deployment. !Raster matrix diagram of operational levers, risks, and validation checks for Prerendering Success Metrics: How to Measure ROI After Implementation.
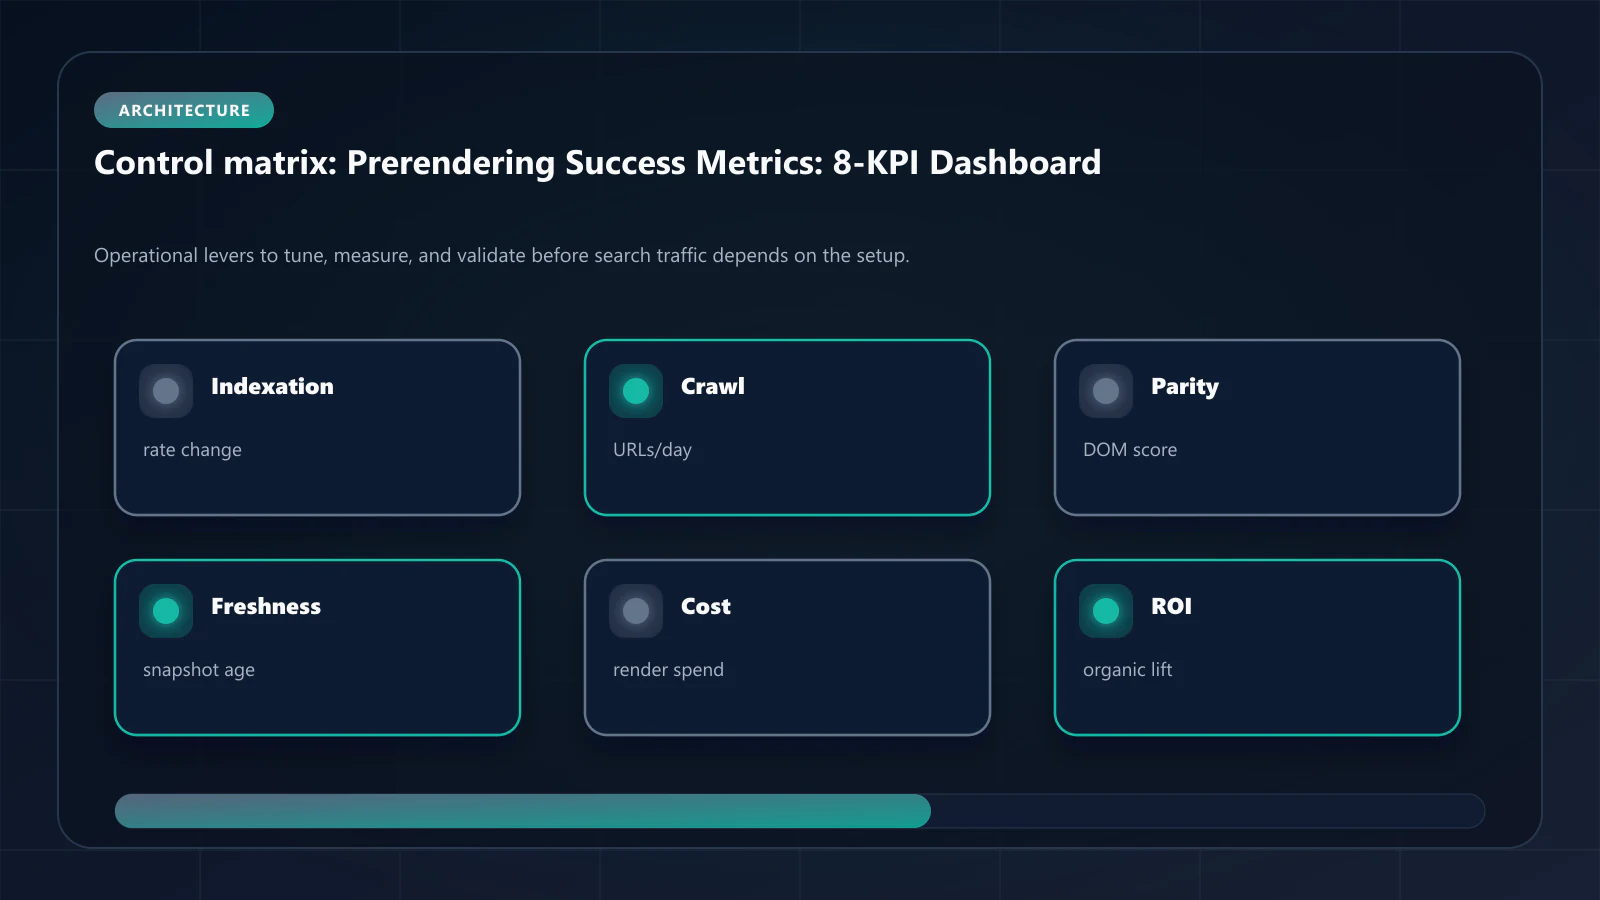
Editorial trust
Written by prerender Editorial · Engineering Team. We build and run pre-rendering infrastructure for more than 200 engineering teams, which is where the numbers and code samples on this page come from.
Last updated . Editorial scope and review policy: About prerender.info.