JavaScript SEO
Canvas & WebGL Content Indexing for SEO
Make Canvas and WebGL content visible to search and AI crawlers — convert pixel output to HTML Googlebot, GPTBot, ClaudeBot read.

Article
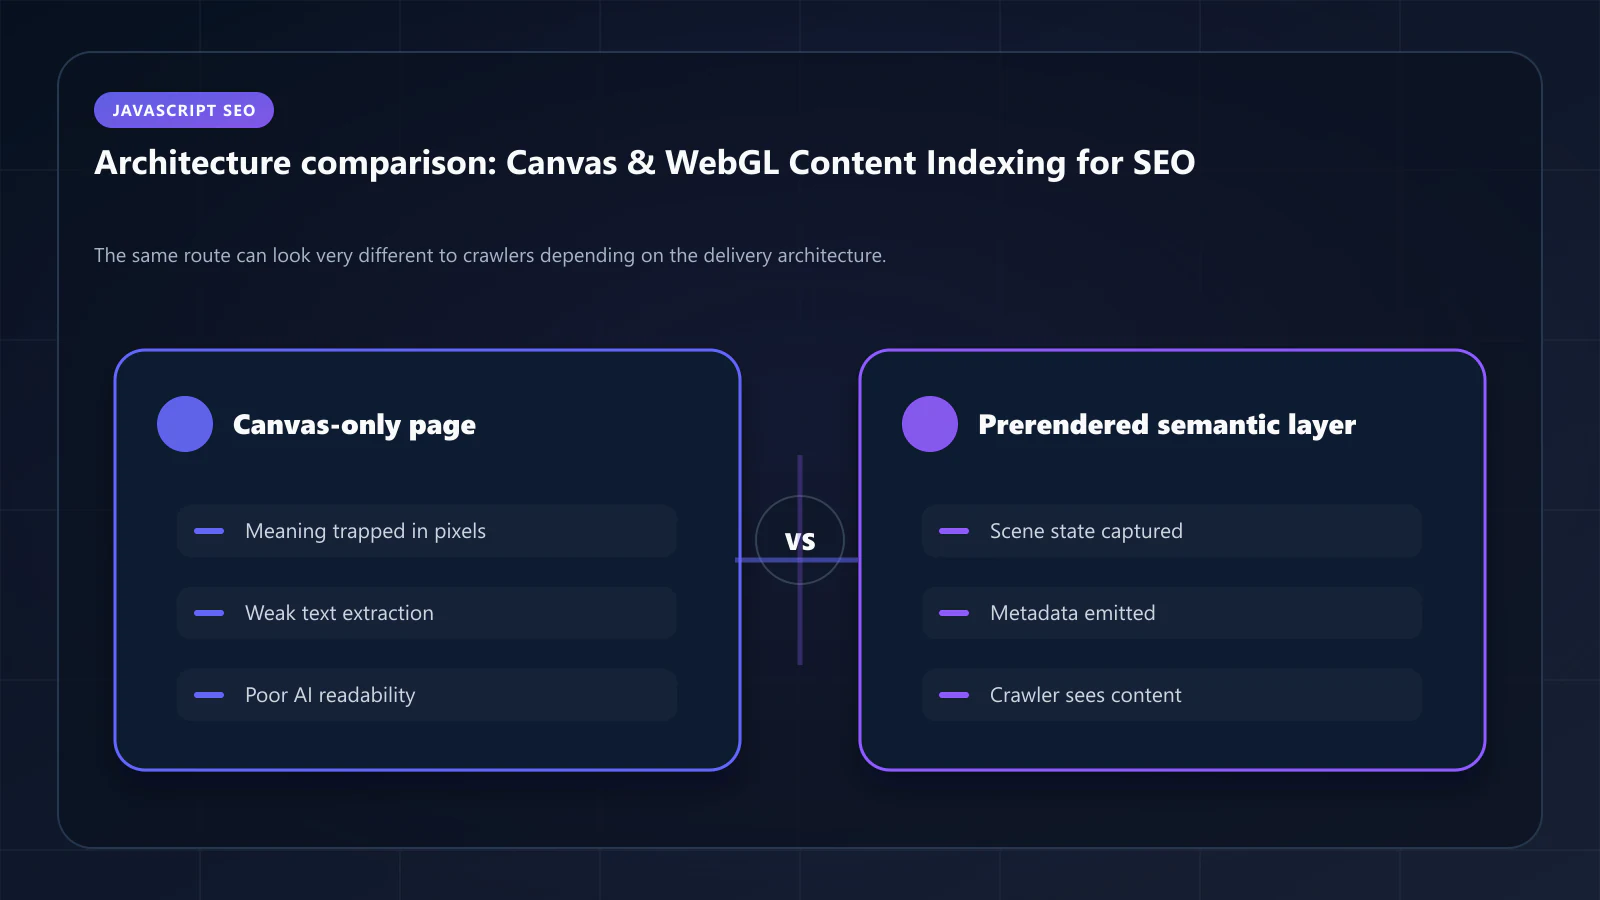
Canvas and WebGL render content as bitmap images — pixels on a surface, not HTML elements. Crawlers cannot read this content directly. A real estate site that renders its property map via Canvas, a 3D product viewer built on WebGL, or a financial chart drawn with the Canvas API — all of these produce visual content that is completely invisible to Googlebot, GPTBot, and ClaudeBot.
Indexation requires converting the visual output back to semantic HTML through prerendering combined with a data extraction pattern. This guide covers why pixel-rendered content is invisible, how the extraction works, and what vertical-specific implementations look like.
Why Canvas Content Is Invisible to Crawlers
The Canvas API draws graphics by manipulating pixels on a 2D or WebGL context. The drawing commands — fillText(), drawImage(), fillRect(), strokeText() — produce a visual result but leave no DOM nodes. Googlebot parses the DOM tree. There is nothing there to read.
// This text is visible to users — completely invisible to crawlersconst canvas = document.getElementById('map-canvas')const ctx = canvas.getContext('2d')ctx.font = '14px Arial'ctx.fillText('3 bedroom, $450,000', x, y) // Property label on map// Googlebot sees: <canvas id="map-canvas"></canvas>// The text '3 bedroom, $450,000' does not exist in the DOMThe same applies to WebGL: vertices, textures, and fragment shaders produce visual output that exists only in the GPU rendering buffer, not in the document tree. A 3D product viewer — however interactive and informative for users — contributes zero entity mentions, zero product attributes, and zero structured data to the crawlable page.
For real estate sites that render property maps via Canvas, location labels, property markers, price data, and neighborhood boundaries are completely invisible to search crawlers. For e-commerce 3D product viewers, the product dimensions, material descriptions, and variant information visible to users are absent from the DOM that Googlebot indexes.
The Scale of the SEO Gap for Canvas-Heavy Pages
The semantic density gap between what users see and what crawlers index is extreme for Canvas-heavy pages:
| Content Element | User View | Crawler View |
|---|---|---|
| Property labels on map | 50+ property names, prices, addresses | None |
| 3D product attributes | Dimensions, materials, 10+ specs | None (or separate HTML elements) |
| Chart data values | 12 months × 5 metrics = 60 data points | None |
| Interactive diagram text | All label text | None |
| WebGL scene objects | All visible 3D objects | None |
This is not a JavaScript rendering delay problem — it is a fundamental architecture problem. Even if Googlebot renders JavaScript perfectly and waits indefinitely, Canvas pixel content cannot be read from the DOM because it does not exist there.
The Data Layer Extraction Pattern
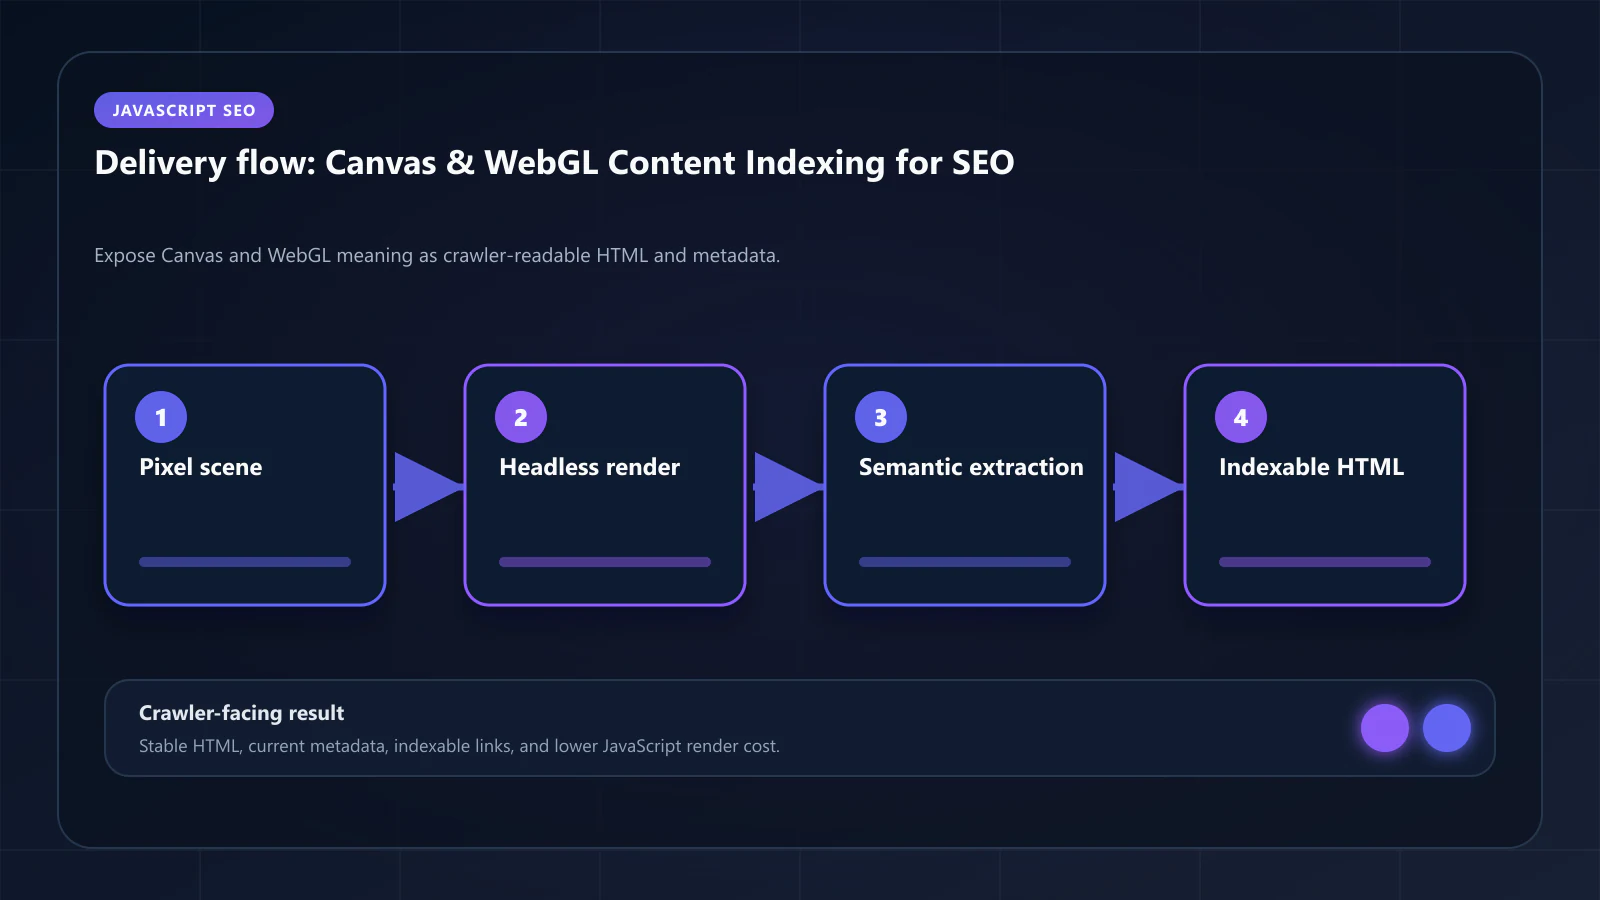
The solution is architectural: render the underlying data twice — once for visual rendering (Canvas/WebGL), and once for indexation (HTML).
The prerendering approach for Canvas content:
- Execute the full JavaScript application in headless Chrome
- The Canvas renders its visual output as usual
- Simultaneously, extract the semantic data that the Canvas is visualizing from the data layer
- Inject that data as structured HTML elements in the document alongside the Canvas
- Capture the snapshot — which contains both the Canvas element and the structured HTML
The HTML layer is what Googlebot indexes. The Canvas layer is what users see. Both exist in the same DOM simultaneously.
// Pattern: dual rendering for Canvas property map// 1. Canvas renders visual mapfunction renderPropertyMapCanvas(properties, canvas) { const ctx = canvas.getContext('2d') properties.forEach(property => { // Draw property marker at coordinates ctx.fillText(property.price, property.x, property.y) ctx.fillText(property.address, property.x, property.y + 20) })}// 2. Simultaneously inject semantic HTML for indexationfunction injectIndexablePropertyData(properties, container) { const list = document.createElement('ul') list.className = 'sr-only property-index-list' // Hidden visually, indexable properties.forEach(property => { const item = document.createElement('li') item.innerHTML = ` <span class="property-address">${property.address}</span> <span class="property-price">$${property.price.toLocaleString()}</span> <span class="property-beds">${property.beds} bedrooms</span> <span class="property-sqft">${property.sqft} sq ft</span> ` list.appendChild(item) }) container.appendChild(list)}// Both functions receive the same data sourceconst properties = await fetchProperties(viewport)renderPropertyMapCanvas(properties, mapCanvas)injectIndexablePropertyData(properties, document.querySelector('.map-container'))The sr-only class hides the HTML list visually (using position: absolute; width: 1px; height: 1px; overflow: hidden) while keeping it in the DOM for crawler and screen reader access. This is not cloaking — the data is identical to what the Canvas renders; only the presentation format differs.
WebGL 3D Product Viewers
WebGL product viewers are increasingly common in e-commerce: furniture, footwear, electronics, and apparel sites use 3D models to let users examine products from any angle. The 3D model file contains rich product data — dimensions, materials, finish options — that is never surfaced in the DOM.
The indexable layer for WebGL viewers follows the same pattern: extract product attributes from the 3D model metadata and data layer, and render them as structured HTML.
// Extract product data from 3D model metadataasync function loadProductWith3DViewer(productId) { const [product3DModel, productData] = await Promise.all([ load3DModel(productId), fetchProductData(productId) ]) // Render 3D viewer const viewer = initWebGLViewer(document.getElementById('product-viewer')) viewer.loadModel(product3DModel) // Inject indexable product spec block const specBlock = document.getElementById('product-specs-indexable') specBlock.innerHTML = ` <h2>${productData.name}</h2> <dl> <dt>Dimensions</dt> <dd>${productData.width}" W × ${productData.depth}" D × ${productData.height}" H</dd> <dt>Material</dt> <dd>${productData.material}</dd> <dt>Finish Options</dt> <dd>${productData.finishes.join(', ')}</dd> <dt>Weight</dt> <dd>${productData.weightLbs} lbs</dd> </dl> `}For prerendering, this injection happens as part of normal application execution. The prerendered snapshot captures the fully populated spec block alongside the WebGL viewer element. Googlebot indexes the spec block. Users interact with the 3D viewer. The Product schema in JSON-LD should mirror the spec block data, creating the schema-content alignment that AI systems evaluate.
Real Estate Map Indexation
Real estate is the highest-stakes vertical for Canvas SEO. Property search pages that render their listings exclusively on a Canvas map have no indexable content for individual location pages — which means they cannot rank for "houses for sale in [neighborhood]" queries at scale.
The comprehensive indexation strategy for real estate Canvas maps:
Viewport-based property lists: When the map viewport changes, update the indexable HTML list with the properties visible in the current viewport. The prerendered snapshot captures the default viewport's property list.
Location page architecture: Each neighborhood or area should have a dedicated URL with a prerendered property list — not just a filtered canvas map view. The URL /properties/brooklyn/park-slope should render a page with a property list in HTML, even if the map is the primary user interface.
Structured data for properties: Each indexable property in the HTML list should have corresponding schema markup. For property search pages, ItemList with ListItem entries referencing RealEstateListing (or Product as a fallback) entities provides the structured data layer that complements the indexed prose.
{ "@context": "https://schema.org", "@type": "ItemList", "name": "Houses for Sale in Park Slope, Brooklyn", "itemListElement": [ { "@type": "ListItem", "position": 1, "item": { "@type": "RealEstateListing", "name": "3 Bedroom House at 123 Main St", "price": "1250000", "priceCurrency": "USD", "numberOfRooms": "3", "floorSize": { "@type": "QuantitativeValue", "value": "1800", "unitCode": "FTK" } } } ]}This JSON-LD must be in the prerendered static HTML, not generated by client-side JavaScript. The non-visual elements prerendering guide covers this implementation pattern.
Interactive Data Visualizations and Charts
Business intelligence pages, analytics dashboards, and financial comparison tools often use Canvas for charts. The chart content — data values, axis labels, legend entries, data point values — is drawn on Canvas and absent from the DOM.
For indexable charts, the pattern is:
- Render the chart to Canvas for visual experience
- Render the underlying data as an accessible HTML table
- Apply
aria-hidden="true"to the Canvas (screen readers cannot interpret pixel content) - Apply
role="img" aria-label="[chart description]"for assistive technology context - Visually hide the HTML table if needed (or keep it visible as a data table, which is often better UX anyway)
<!-- Chart with accessible and indexable data table --><div class="chart-container"> <canvas id="revenue-chart" aria-hidden="true"></canvas> <table class="chart-data" aria-label="Monthly Revenue Data"> <caption>Q1 2026 Revenue by Month</caption> <thead> <tr><th>Month</th><th>Revenue</th><th>YoY Growth</th></tr> </thead> <tbody> <tr><td>January</td><td>$2.4M</td><td>+18%</td></tr> <tr><td>February</td><td>$2.7M</td><td>+22%</td></tr> <tr><td>March</td><td>$3.1M</td><td>+31%</td></tr> </tbody> </table></div>The HTML table is what Googlebot indexes. The specific revenue figures, growth percentages, and temporal data represent the high-value content that AI systems evaluate for SCDL optimization — and that data is only available if it exists in the DOM, not in Canvas pixels.
Is This Pattern Cloaking?
No. Cloaking means serving different content to crawlers than to users with the intent to manipulate rankings. The dual rendering pattern serves the same data in two presentations: visual (Canvas/WebGL) for users, structured HTML for crawlers and screen readers.
Google's guidelines permit this pattern explicitly under accessibility-driven implementations. The HTML table for a chart is a standard accessible alternative. The property list alongside a map is standard accessible content for users who cannot interact with the visual map.
The test: if a visually impaired user would benefit from the HTML alternative, and if the HTML content accurately represents what the visual rendering shows, it is not cloaking — it is accessible design that happens to also be indexable.
Frequently Asked Questions
No. Google cannot read Canvas pixel content. Any text or data rendered only via Canvas is not indexable. There is no second-wave rendering path that reads pixel values — Googlebot can only read DOM nodes. The dual rendering pattern described here is the only viable approach for indexing Canvas-rendered data.
For simple markers (pins, dots), yes — CSS-positioned elements are in the DOM and indexable. For complex visual content (property boundaries, interpolated heatmaps, satellite imagery overlays), Canvas or WebGL is required, and the dual rendering pattern applies.
Three.js and Babylon.js render to WebGL. The same principle applies: the 3D scene content exists only in the rendering buffer. The entity data populating the scene — product names, dimensions, room labels in architectural viewers — should be injected as structured HTML alongside the `<canvas>` element. Some Three.js scenes include HTML overlays (`CSS3DRenderer`) that create DOM nodes coinciding with 3D positions — these are indexable and should be used wherever possible for label content.
The dual rendering pattern is an application architecture decision. Prerendering infrastructure executes the full JavaScript application including Canvas initialization and data injection. The prerendered snapshot captures the populated HTML layer. No special prerendering configuration is needed beyond the standard full-JavaScript execution that headless Chrome provides. The vertical use cases section of the prerendering hub covers real estate and e-commerce applications in detail.
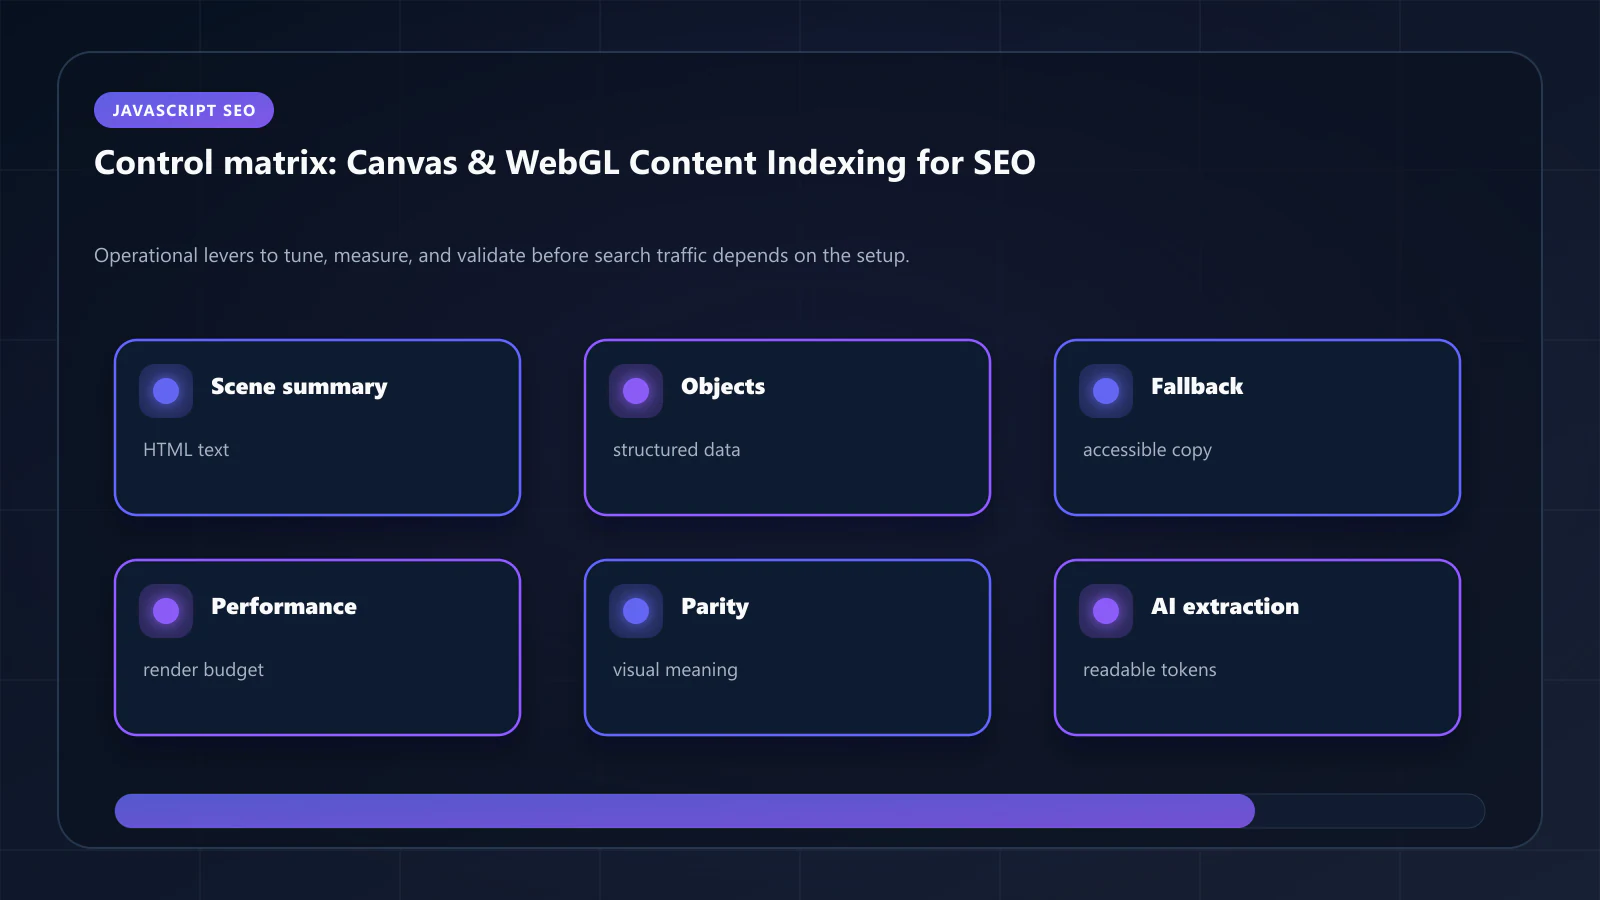
The prerendered snapshot captures the default map viewport — typically the geographic center of the location page with a default zoom level. This snapshot provides the initial indexable content. For location-specific pages, the default viewport should be tuned to show the most relevant properties for that location's landing page query intent. !Raster matrix diagram of operational levers, risks, and validation checks for Canvas & WebGL Content Indexing: How to Make Visual Rendering SEO-Friendly.
Editorial trust
Written by prerender Editorial · Engineering Team. We build and run pre-rendering infrastructure for more than 200 engineering teams, which is where the numbers and code samples on this page come from.
Last updated . Editorial scope and review policy: About prerender.info.